
Crypto Market Intelligence April 2023
by André Dragosch, Head of Research
Key Takeaways
- Cryptoassets posted another positive performance in April due to the successful Ethereum Shapella upgrade
- On-chain indicators for Bitcoin imply solid network activity due to the ongoing inscription saga but also weakening accumulation activity in April
- Increasing US sovereign risks in light of the debt ceiling and the De-Dollarization narrative take center stage at the macro front
Chart of the month

Cryptoasset Performance
Cryptoassets posted another positive performance in April due to the successful Ethereum Shapella upgrade and ongoing high network activity for Bitcoin due to the inscription saga.
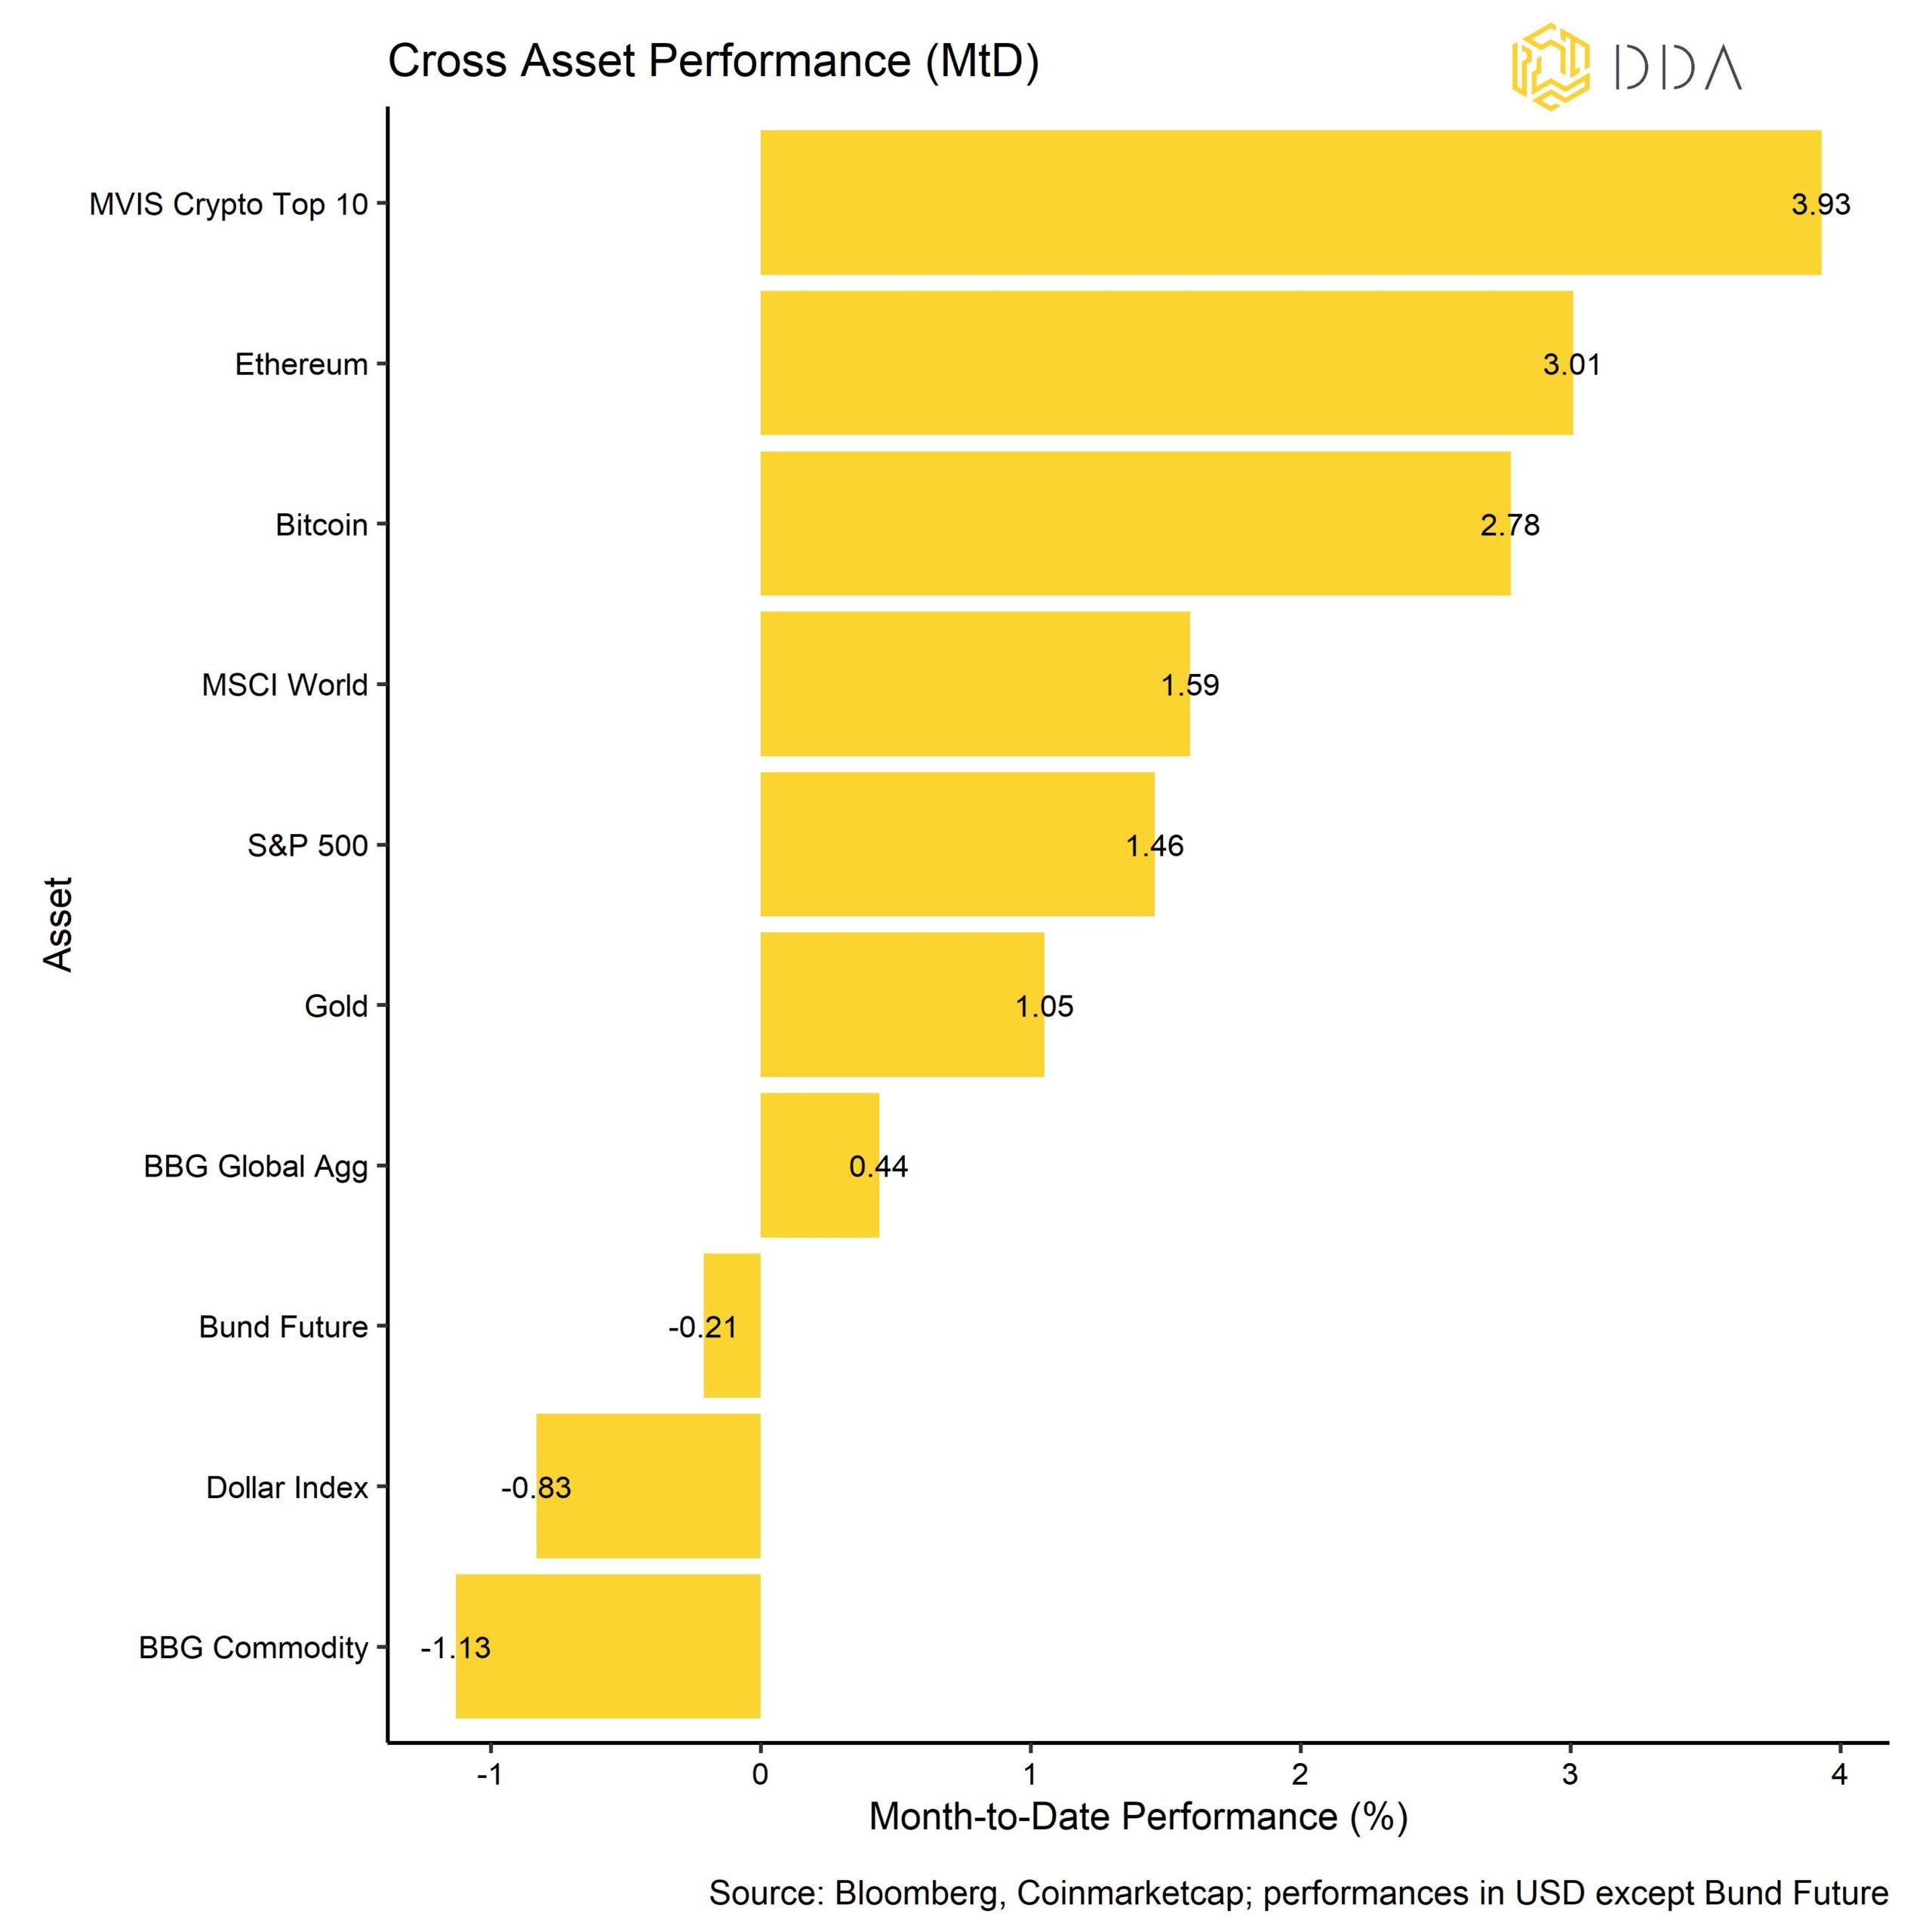
Likewise, our own DDA products also reflect this positive performance development quite well in April:
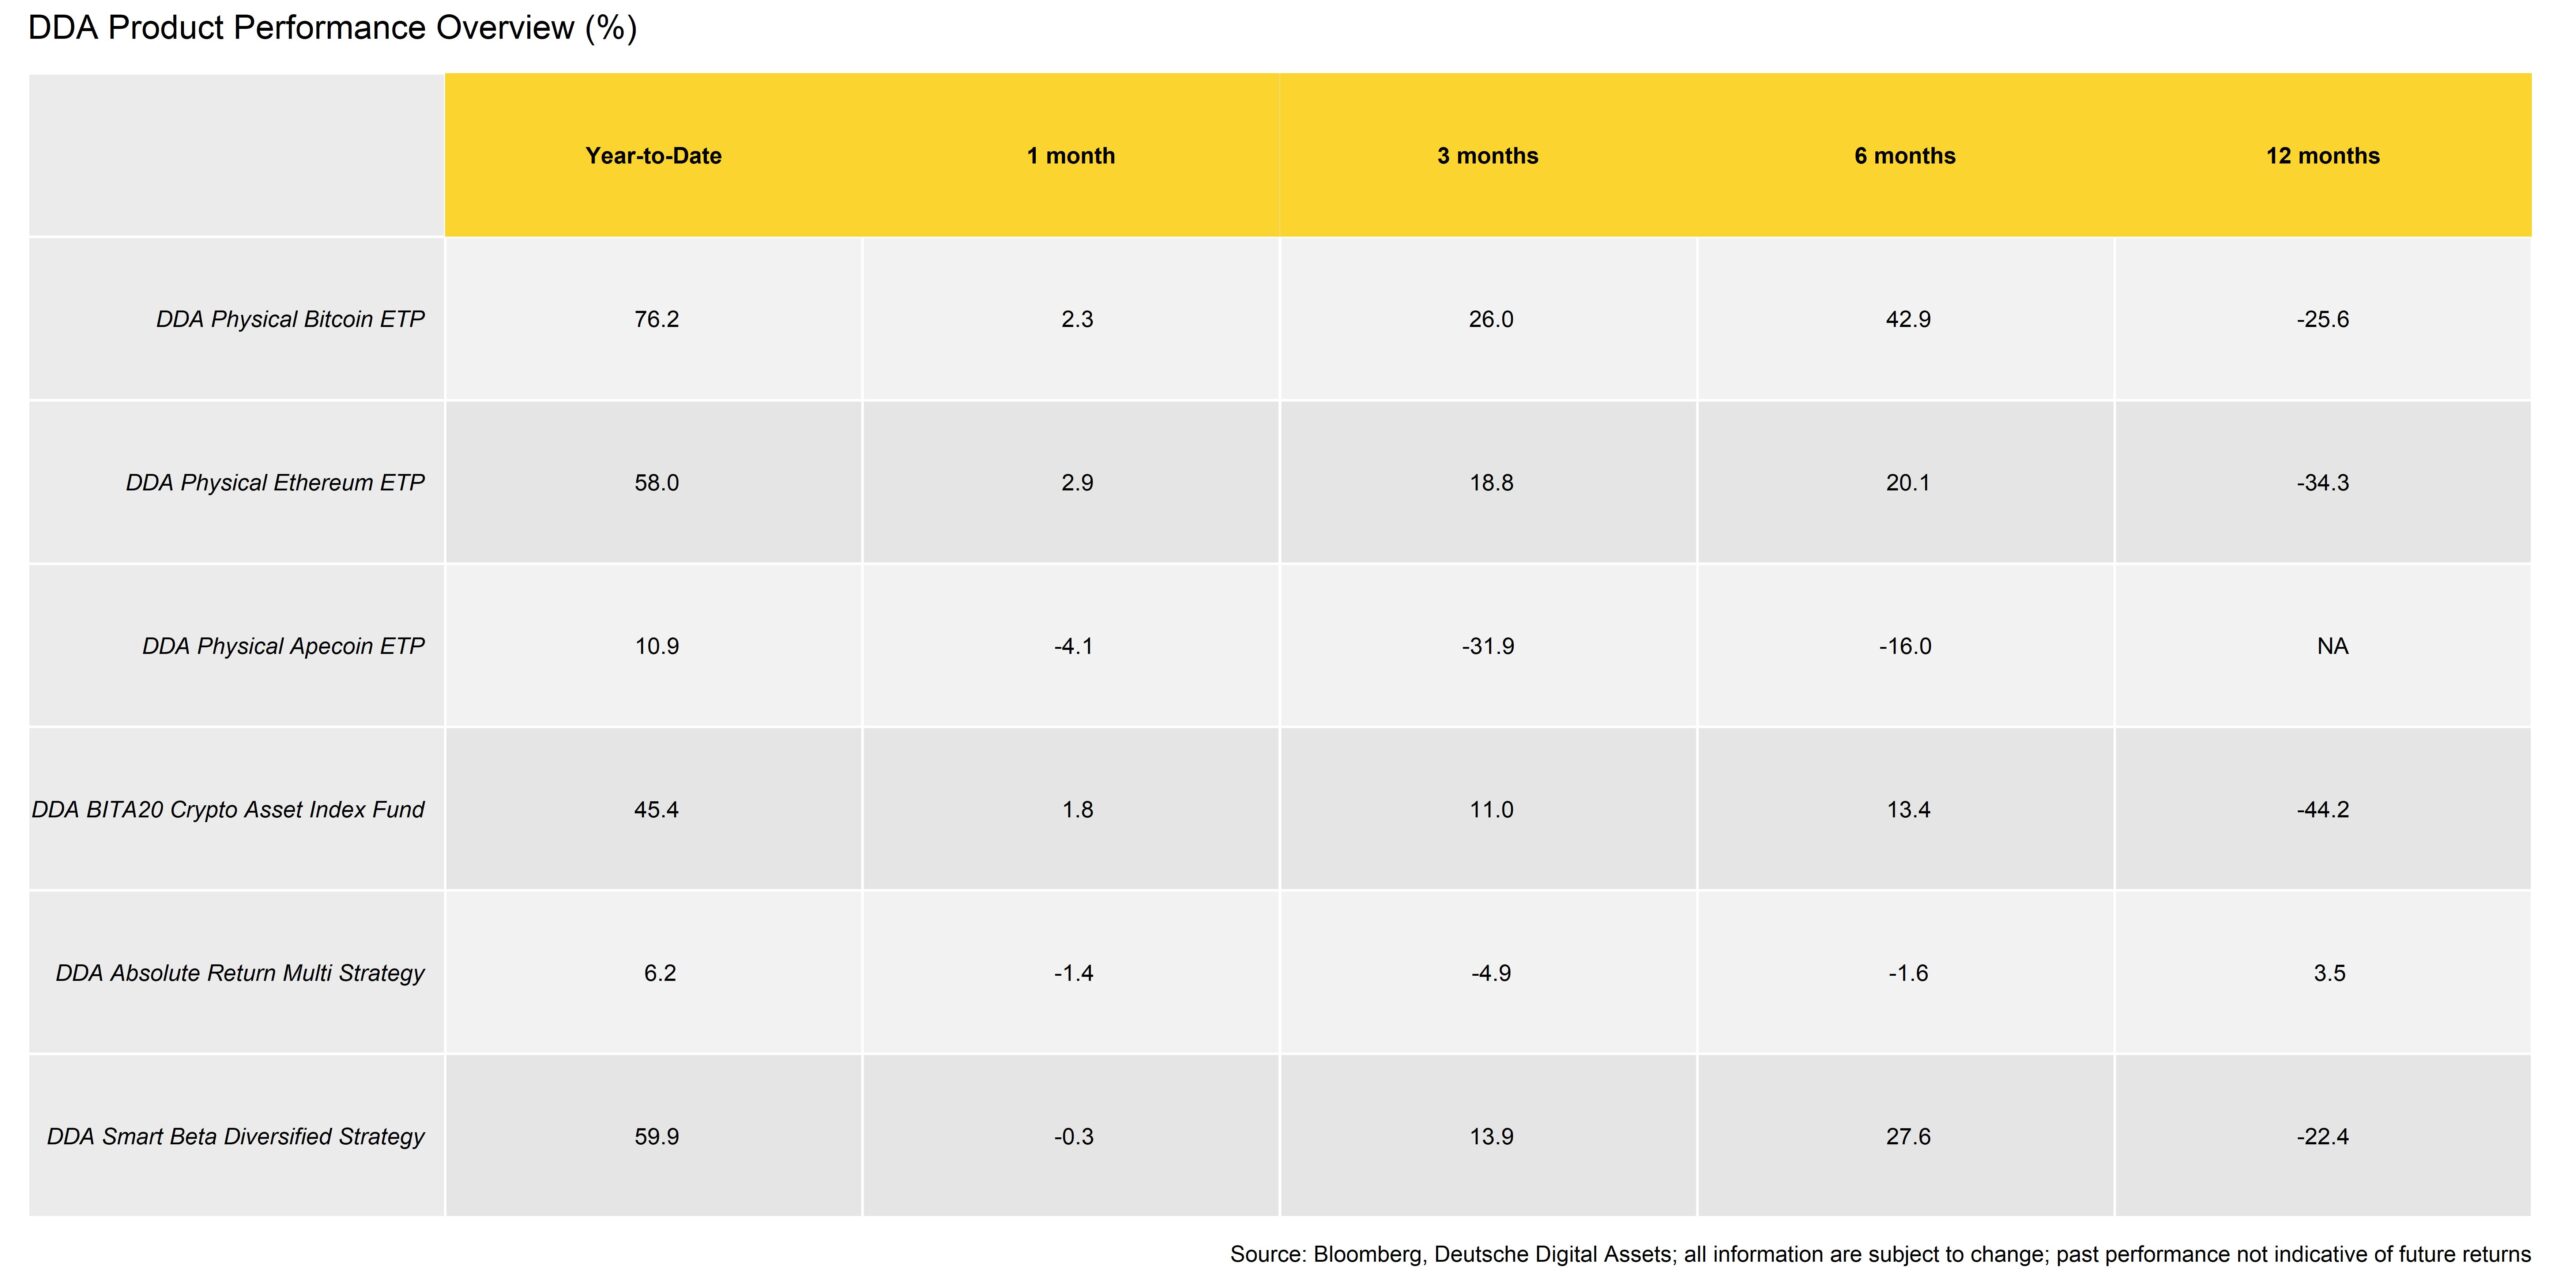
While the Bitcoin and Ethereum ETPs performed very well, the Apecoin ETP underperformed due to the gradual token unlock that will take place over the coming months due to the specific vesting schedule that will allow Yuga Labs’ early developers, the charity and the founders to distribute their tokens. This has most likely exerted some downward pressure on the price.
Moreover, the alpha strategy worked well during the first part of the month but suffered from the chaotic movements of the last ten days, especially the shorter-term strategies. The beta program also underperformed at the end of the month, penalized by momentum strategies that had significant exposure to altcoins, which corrected more sharply.
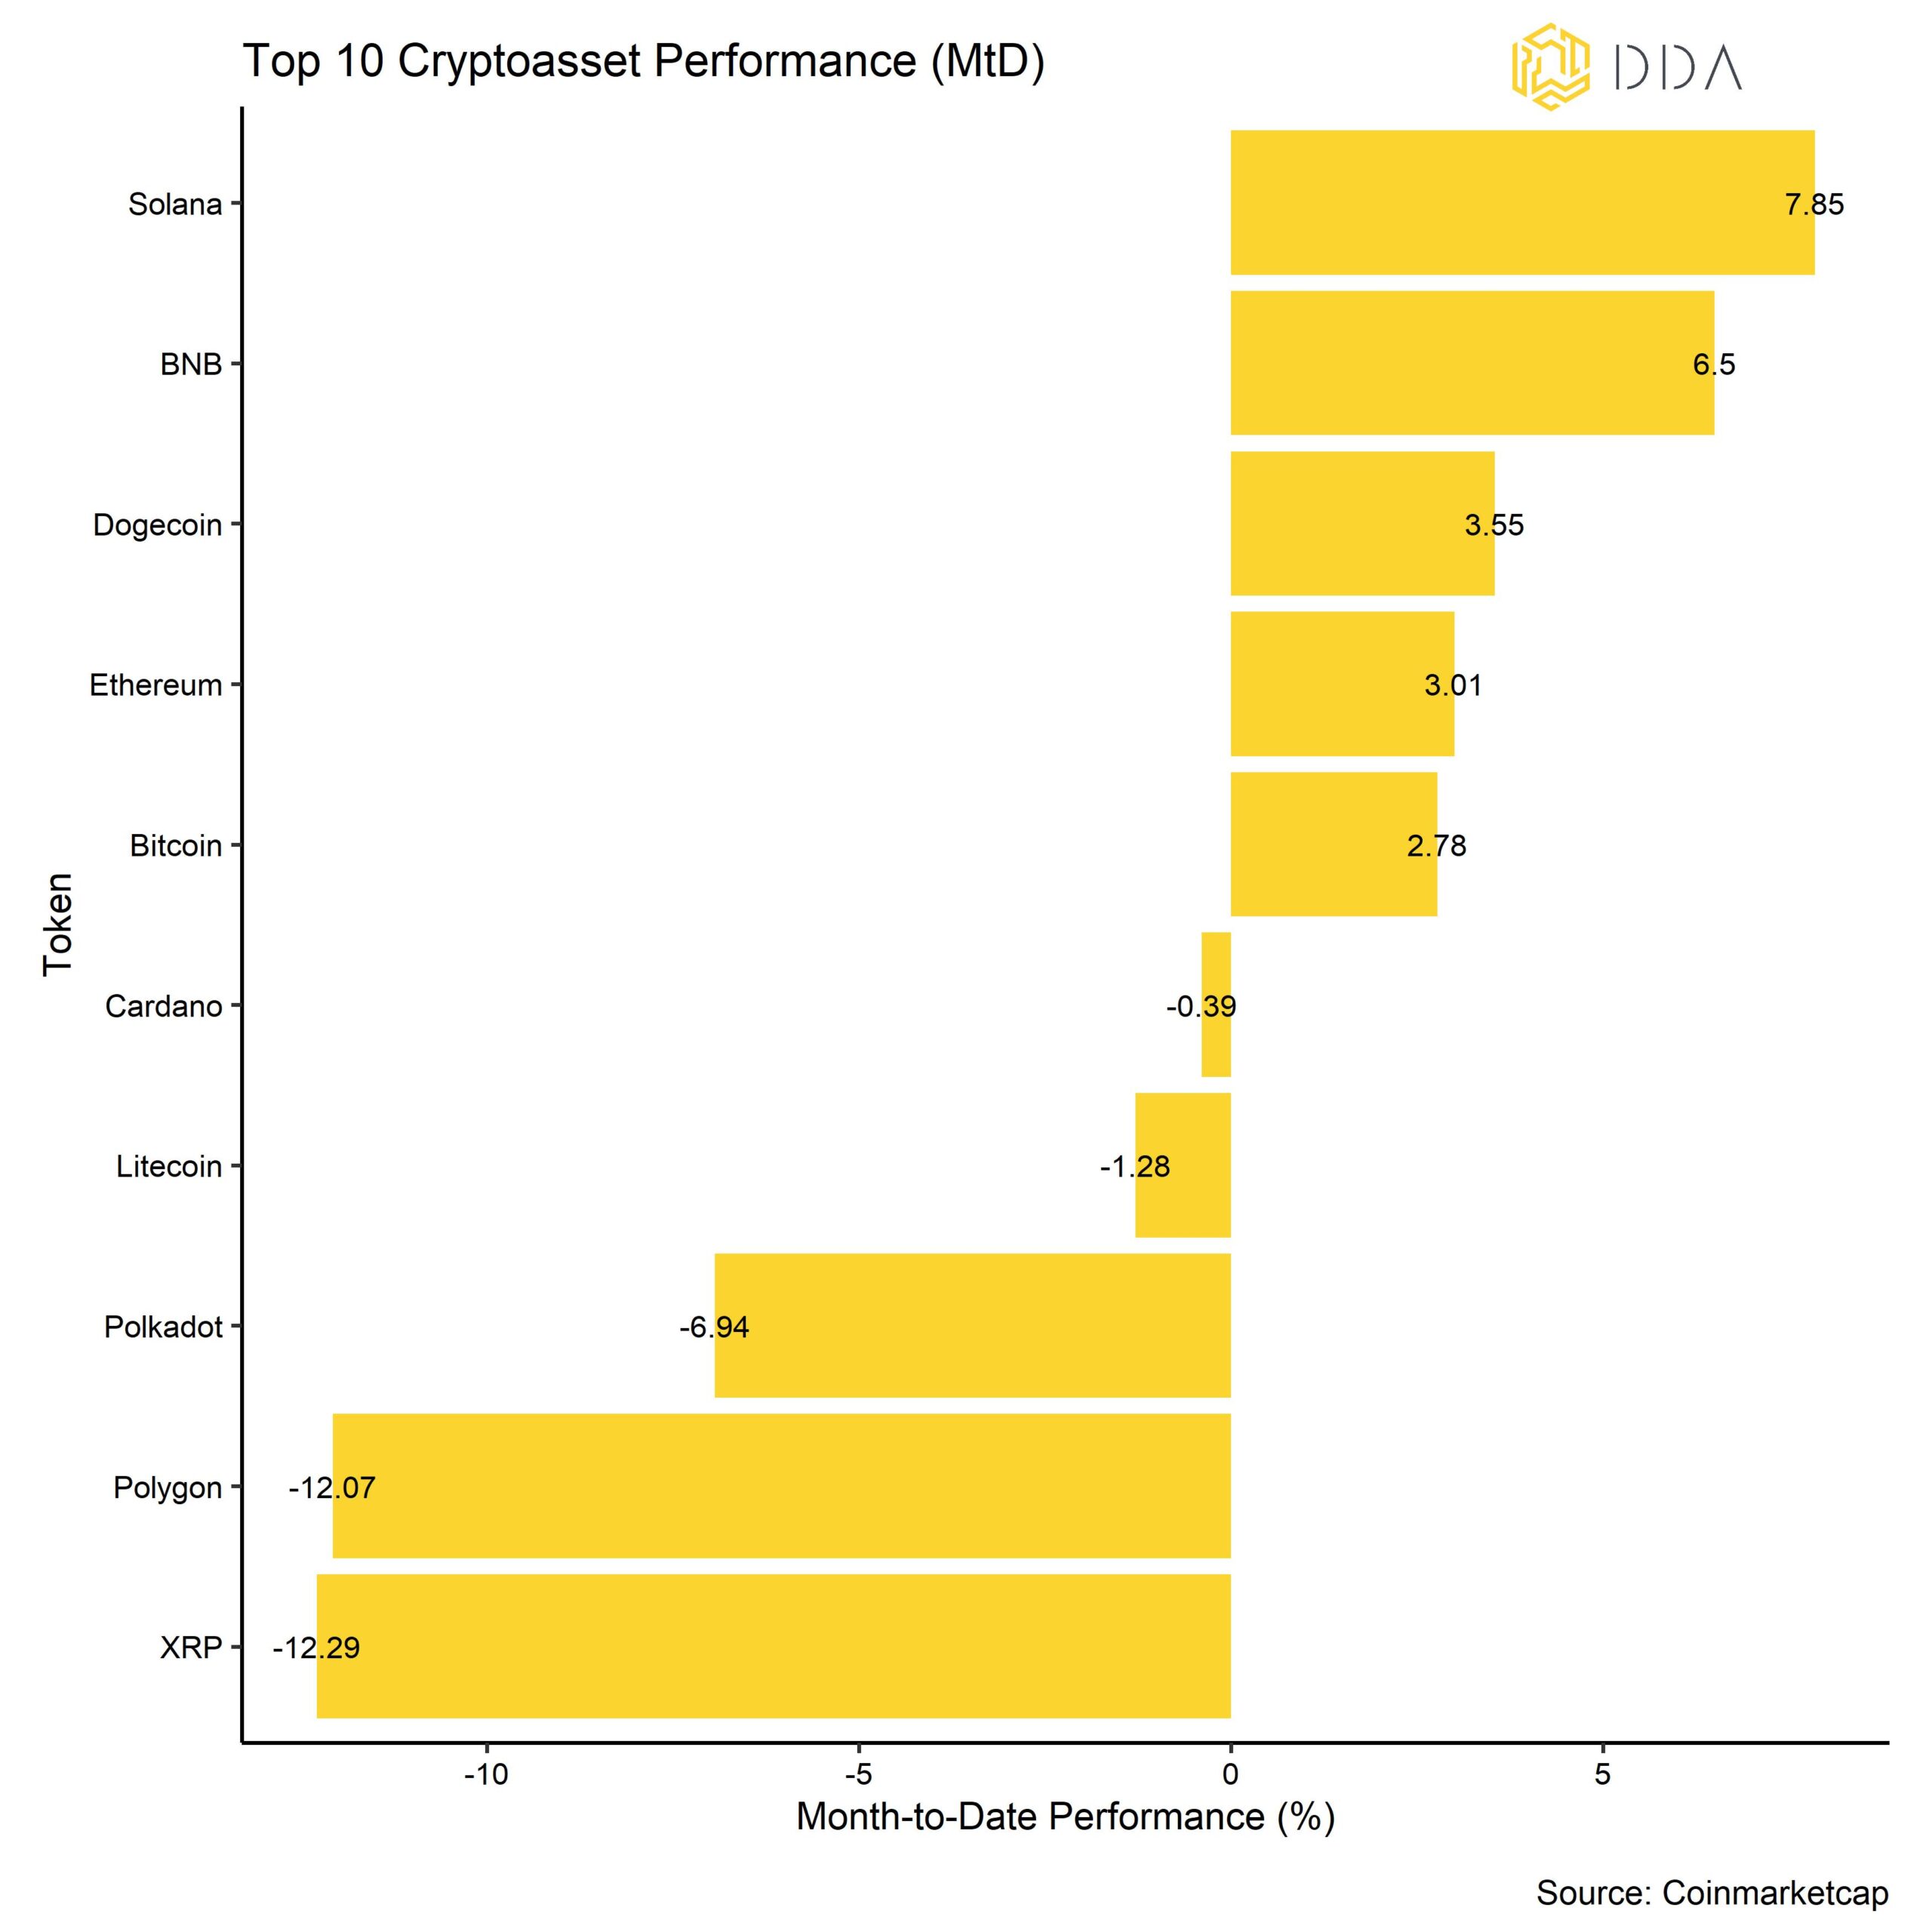
In general, among the top 10 major cryptoassets, Solana, BNB, and Dogecoin have been the main outperformers. Solana has been bolstered by numerous positive developments in the ecosystem and a sharp increase in derivatives open interest. BNB outperformed mainly due to the launch of Binance’s launchpool project, Sui farming while Dogecoin’s performance was lifted by excitement in the meme coin space due to the launch of Pepe coin in April.
After the successful Ethereum Shapella upgrade on the 12th of April, we saw a significant pick-up in Altcoin outperformance vis-à-vis Bitcoin but that has faded out again gradually until month-end. Over the month of April, only 10% of tracked altcoins managed to outperform Bitcoin while it was 45% outperformance just days after the Ethereum upgrade.
Performance dispersion among cryptoassets picked up significantly during the month of April with the Ethereum Shapella upgrade being the main catalyst. An increase in dispersion means that cryptoasset performances are increasingly driven by coin-specific factors in contrast to systematic factors.
Bottom Line: Cryptoassets posted another positive performance in April due to the successful Ethereum Shapella upgrade and ongoing high network activity for Bitcoin due to the inscription saga.
Macro & Markets Commentary
One of the dominant themes on the macro side, was that US sovereign risks have continued to creep up as the debt ceiling deadline looms. According to most estimates, the US Treasury is likely going to run out of cash by July this year which could result in a technical default if the US did miss a coupon or maturity payment on its debt. At the time of writing, the Treasury General Account (TGA) at the Fed has around 166.5 bn USD left but has been shrinking by around -64 bn USD per months this year.
That is also the reason why traders have started bidding up credit default insurance for the US. At the time of writing, US 1-year CDS have increased to 177 bps – the highest reading ever. Assuming a theoretical recovery rate of 40% in the case of default, a CDS rate of 177 bps implies a default probability of 2.95% in 1 year. So, this is still relatively low, but US 1-year CDS as well as 5-year CDS have started to climb very rapidly.
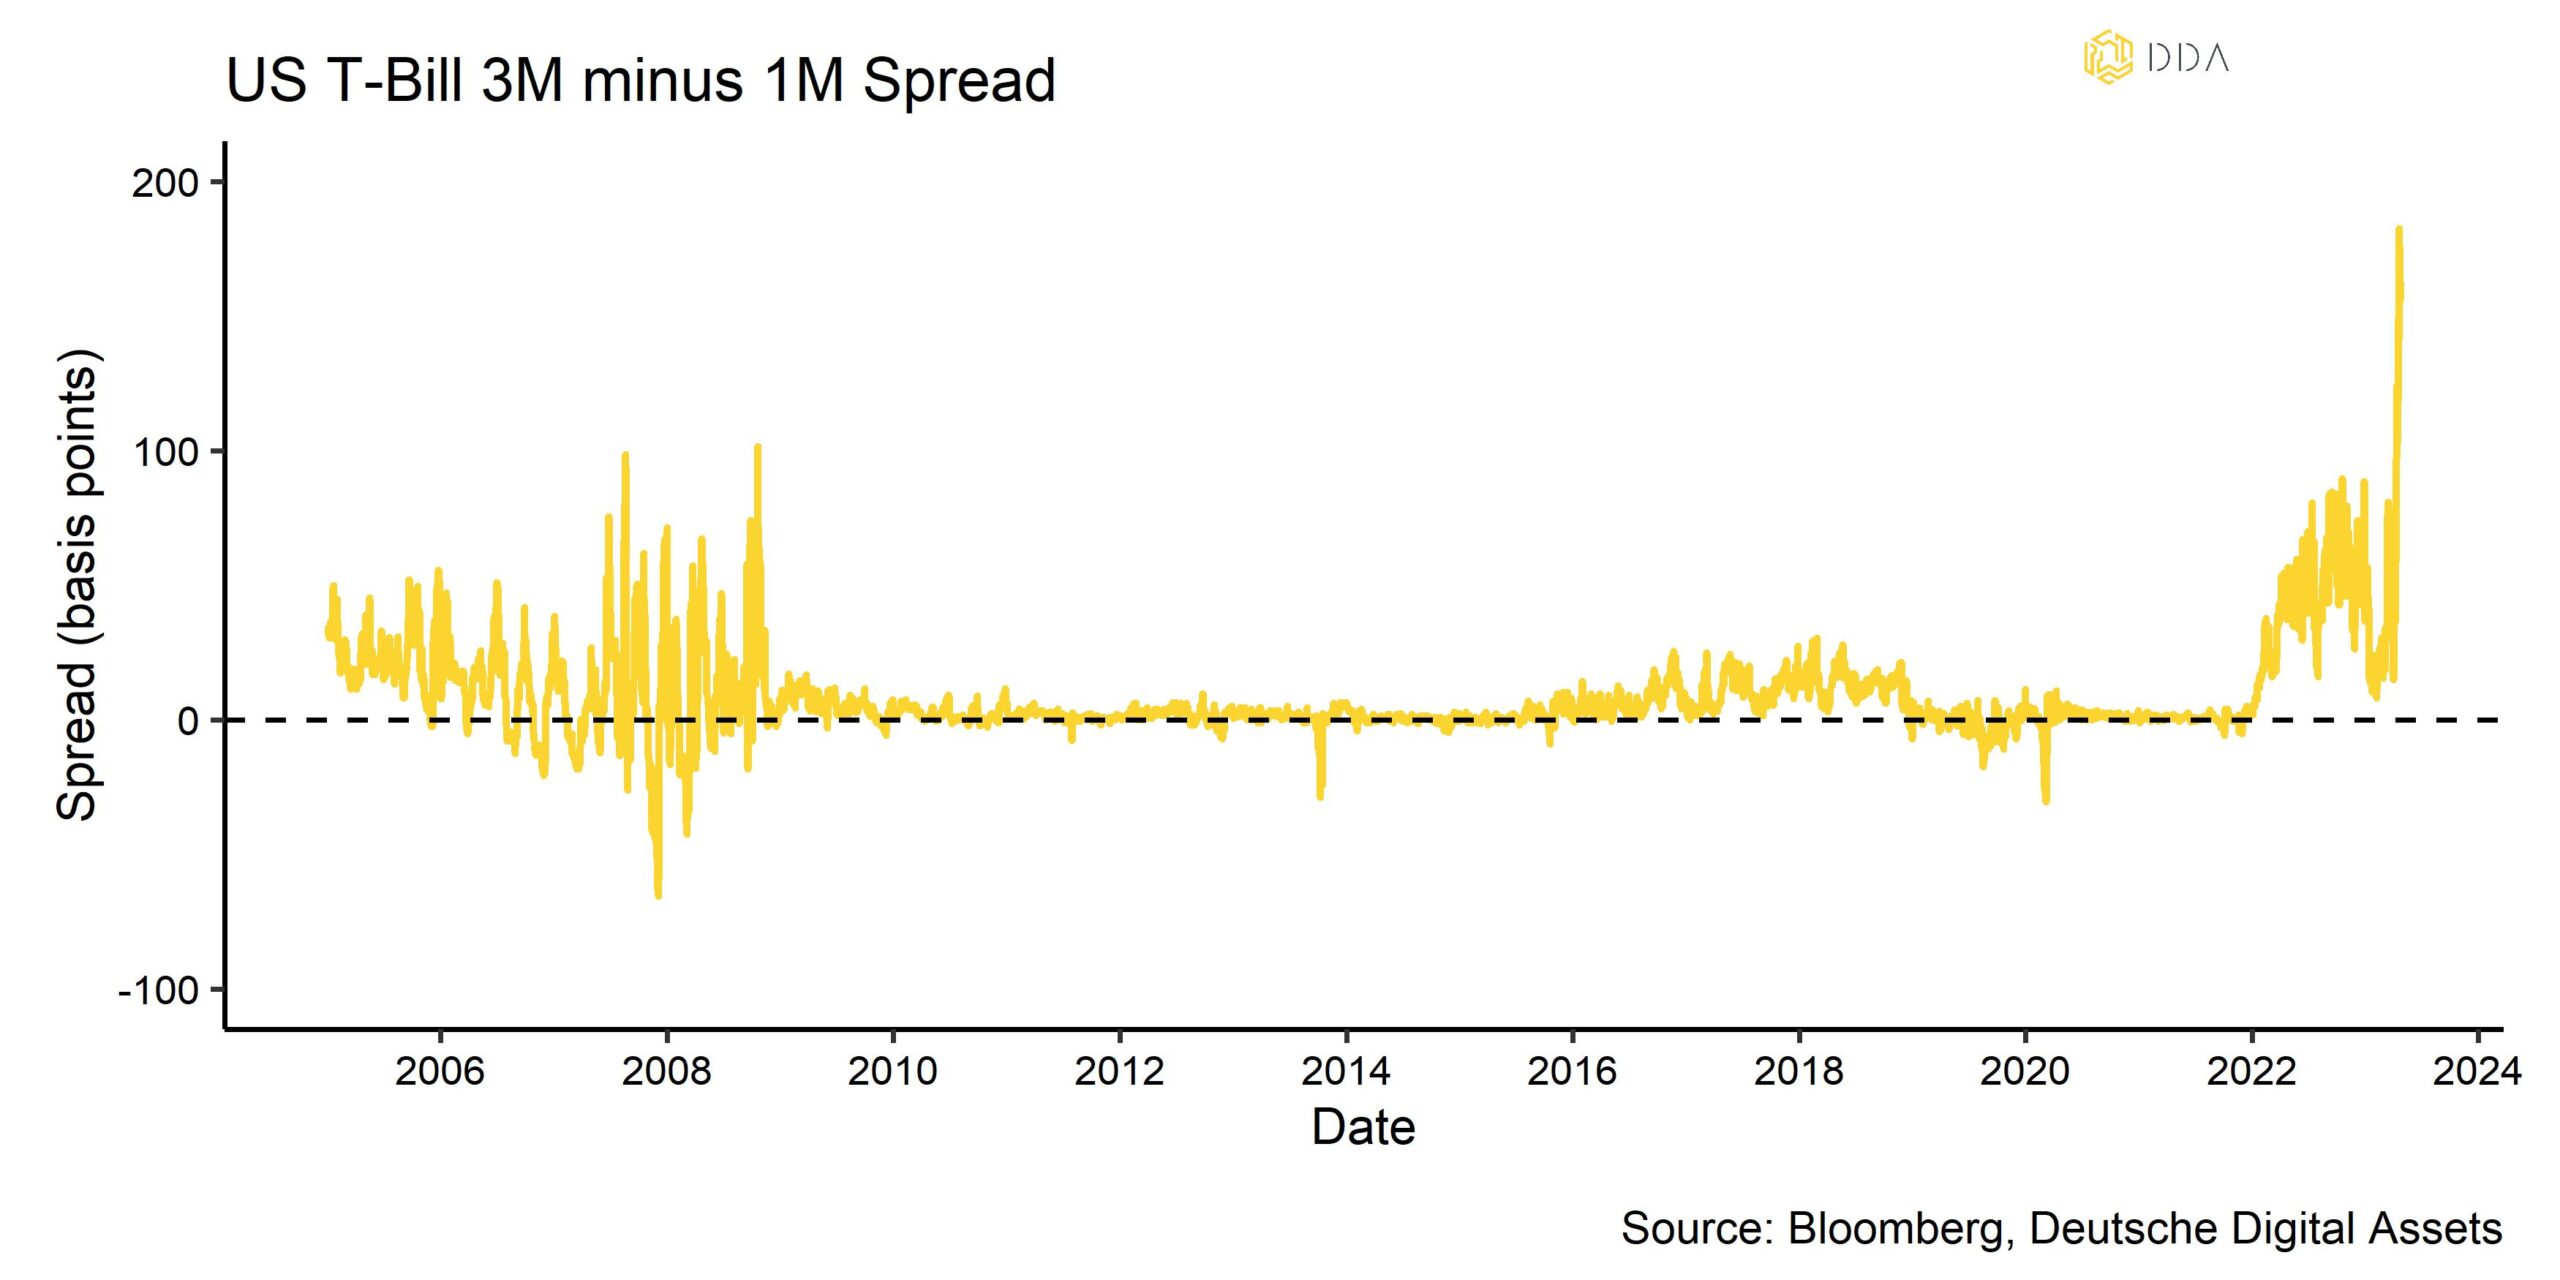
This has also led to some distortions at the front end of the US Treasury curve with 3-month minus 1-month T-Bill spread trading at the highest levels ever recorded. This is at odds with the telegraphed pace of Fed rate hikes that should be more visible in shorter term T-Bill yields such as the 1-month T-Bill and is most-certainly a reflection of increasing risk aversion among bond investors in light of the debt ceiling who shun 3-months T-Bills for 1-month T-Bills but also due to the fact that the US Treasury has curtailed its issuance of 1-month T-Bills lately.
In this context, there are increasing concerns regarding the US Dollar and a potential for “De-Dollarization”, ie strategic divestments out of Dollar-denominated assets by foreign companies and sovereigns.
In general, the De-Dollarization narrative was also supported by political developments in the BRICS countries who decided to denominate bilateral trade in other currencies than the US Dollar and the fact that the most recent central bank gold purchases were the highest since 1967. Gold is still seen as the “anti-Dollar” among traditional financial market participants.
The US Dollar share in global FX reserves still remains at 58.3% per end of 2022 while allocations to competing currencies such as the Chinese Yuan still remain relatively low at 2.3% per end of 2022. Nonetheless, the trend of De-Dollarization is clearly visible in the data:
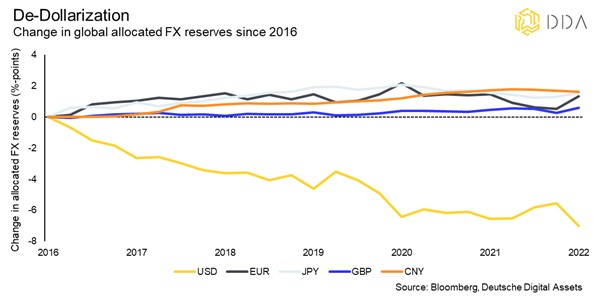
The share of US Dollar in global allocated FX reserves has fallen by more than 7%-points since 2016 while other major currencies’ share has increased.
However, De-Dollarization is a multi-decade structural process and does not happen overnight. That being said, a reversal in US monetary policy and structurally higher rates in Europe and other regions could induce a structural exodus of international equity and bond portfolio flows out of the US which could accelerate De-Dollarization also from a cyclical point of view.
Speaking of the US Dollar, our in-house macro factor model which measures sensitivities and explanatory power of different macro factors for Bitcoin, is showing an increasing sensitivity of Bitcoin towards the US Dollar factor and monetary policy factor in April.
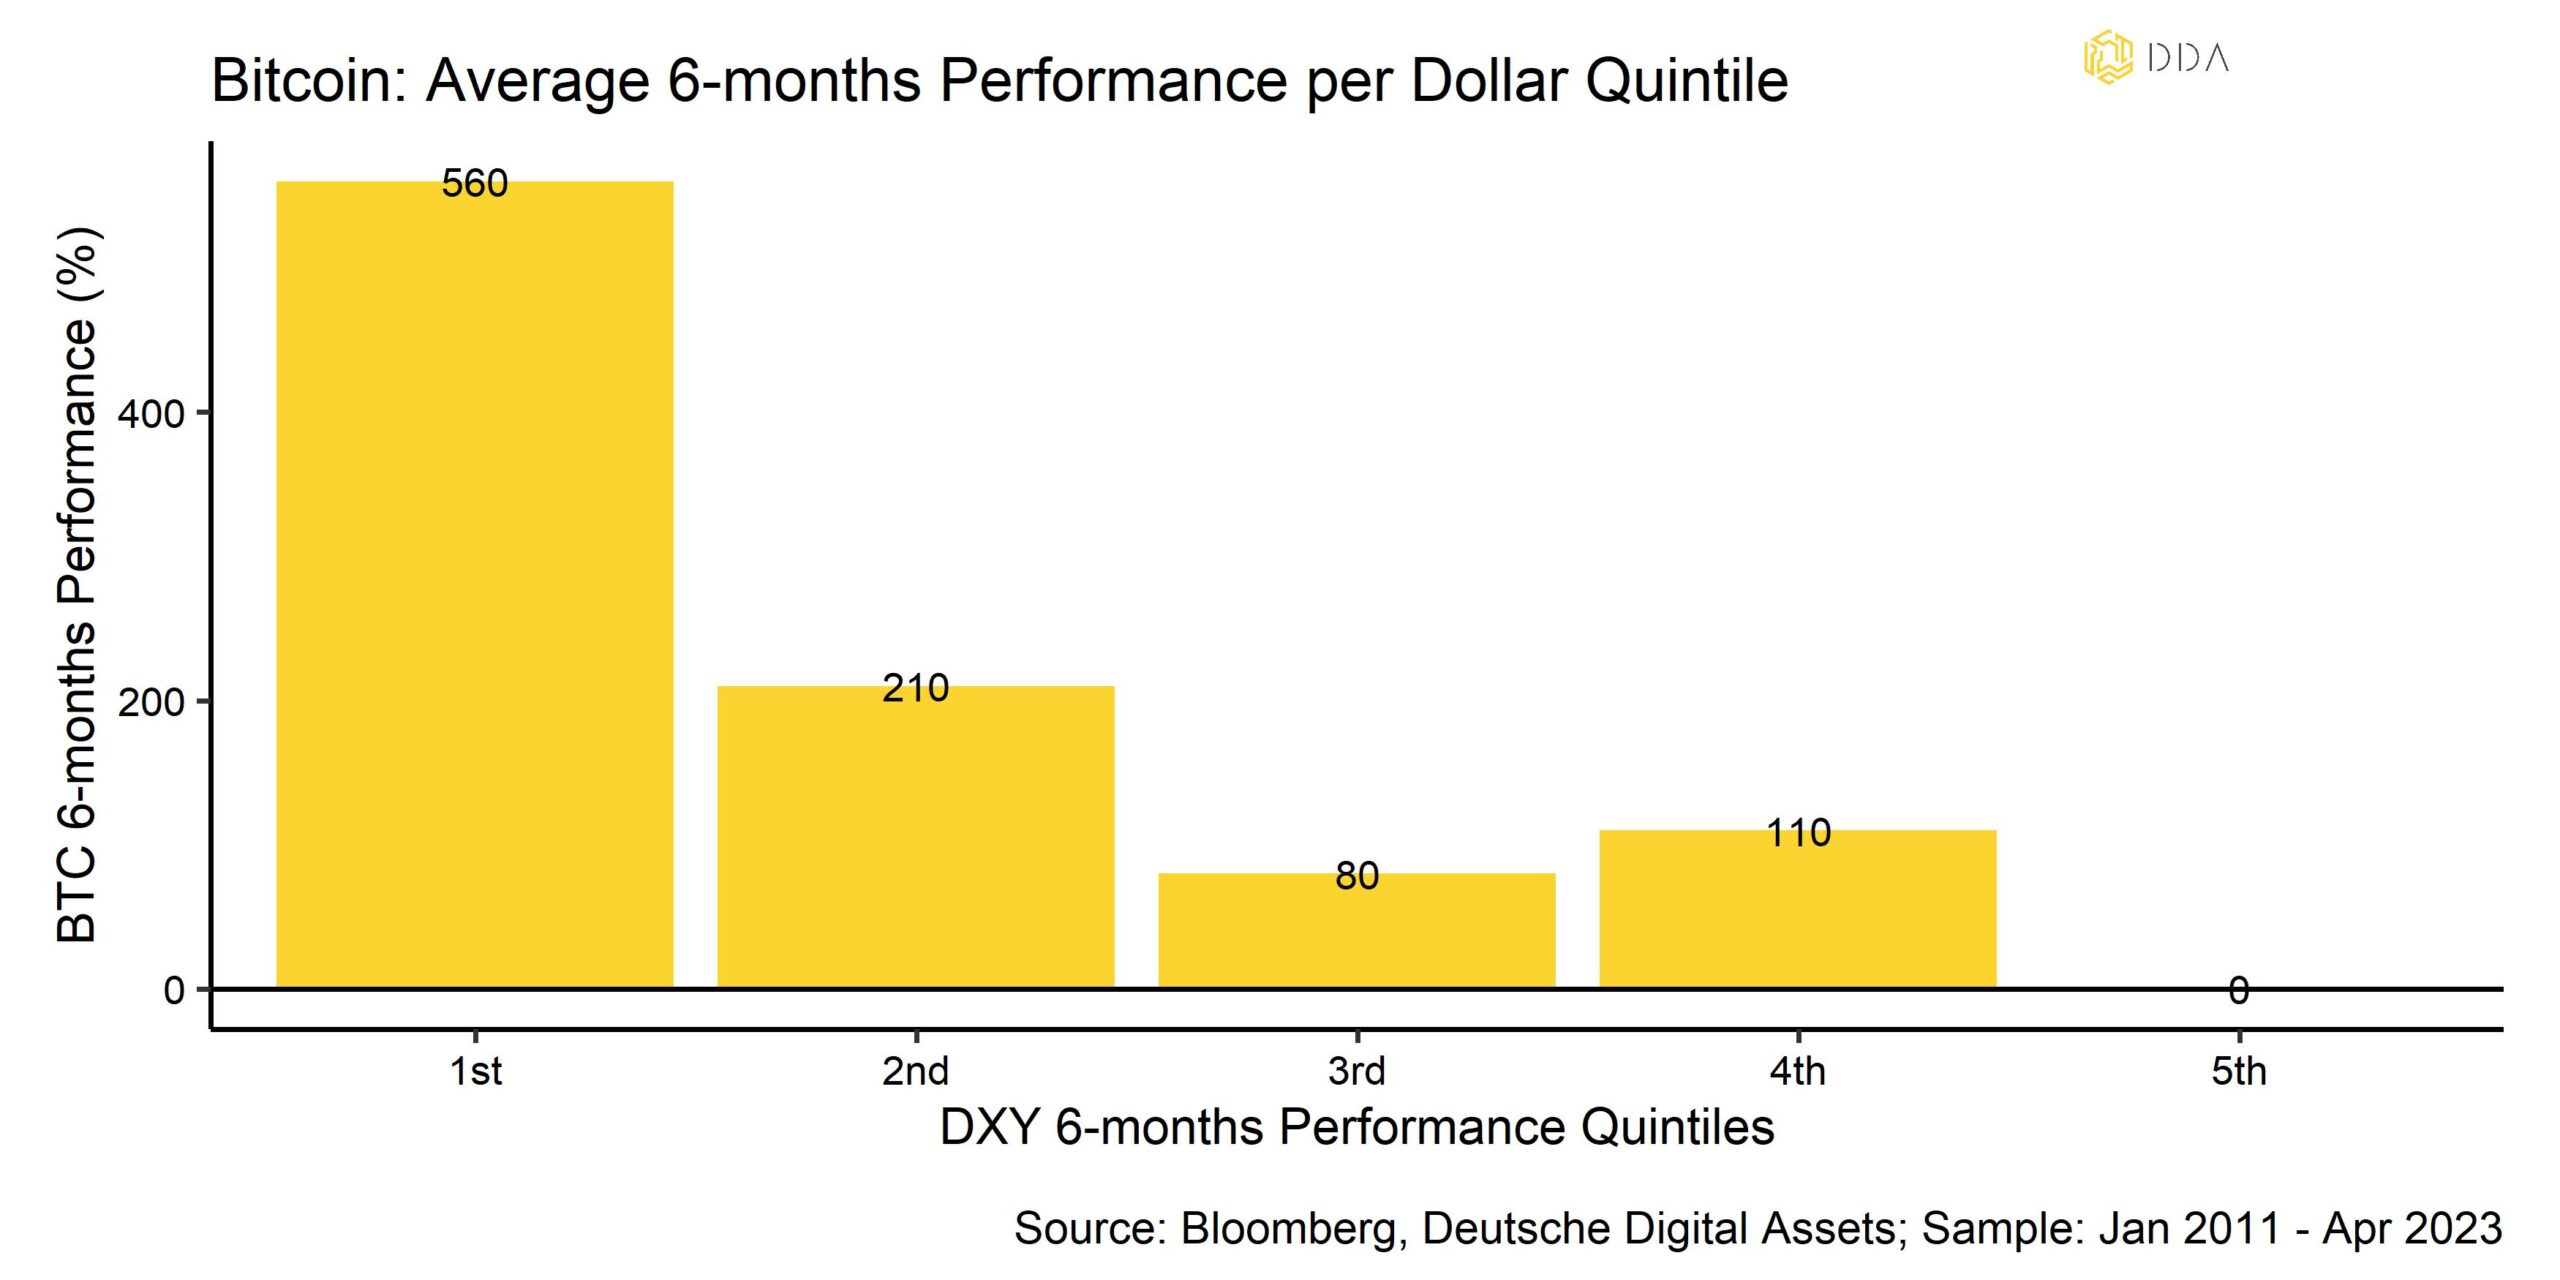
These two macro factors are now the most important ones with respect to Bitcoin price variations. Bitcoin price variations now appear to be particularly sensitive to changes in the US Dollar macro factor (see appendix). 60-day rolling correlations for BTC to the Dollar Index (DXY) have continued to increase but are still negative meaning that Dollar depreciations have been associated with rising Bitcoin prices in the last 60 days.We are reiterating our stance that structural US Dollar weakness would be very bullish for cryptoasset prices and in particular Bitcoin as an alternative global reserve currency contender. This is also highlighted in the following table that shows Bitcoin’s performance conditional on Dollar Index (DXY) performance. The highest Bitcoin performances have historically been observed during periods of significant Dollar weakness (1st DXY performance quintile):
At the same time, the unexplained portion of Bitcoin price variation (“Residual”) has gradually declined and is now below 50%. The high percentage of price variation not explained by macro factors has most-likely been due to the rise of inscriptions and coin-specific network activity.
Recent hawkish comments by FOMC members that suggest a further 25 bp rate hike in May have continued to support an exodus of money from bank deposits into money market funds. It appears that the “whatever it breaks” scenario is still in play, ie the Fed will keep on tightening until financial instability resurfaces. That being said, the market currently expects the Fed to deliver a final rate hike in May and a subsequent 25 bp cut until year-end. This probability that something “breaks” is bound to increase as Dollar liquidity continues to dry up. Anecdotal evidence of acute Dollar shortage in developing countries like Argentina or Egypt adds to the concern that liquidity is still tight globally.
Earnings and sales of regional banks such as First Republic Bank (FRBK) have recently underwhelmed expectations and could be a sign of continuing risks in the banking sector as FRBK reported higher than expected deposit outflows. There is also some evidence that the weakness in FRBK’s share price has supported the latest short-term recovery in cryptoasset prices again. Over the weekend, the US government has brokered a bailout of FRBK with JP Morgan. FRBK’s bank failure also represents one of the biggest in the financial history of the US.
Recent central bank data suggest that banking stress may have stabilized but has not completely subsided judging by commercial banks’ recent usage of the Fed’s BTFP and discount window.
Nonetheless, global growth prospects outside the US continue to positively overwhelm expectations which is most-likely due to an ongoing reacceleration of Chinese growth. In that context, recent positive earnings surprises by large cap US companies may also be due to that factor since most large cap US companies have generally large international sales exposure.
Meanwhile, domestic regional Fed surveys and other leading indicators have mostly confirmed that the US economy is still slowing down. A US recession model by the New York Fed signals with 57.8% probability that the US economy will likely enter a recession over the next 12 months – the highest probability since 1982. Recession appears to be “baked in the cake” and is also consensus among economists surveyed by Bloomberg which see the median recession probability at 65%.
The US recession narrative should gradually fade as a headwind for equity markets and cryptoasset markets as equity markets historically bottom with the through in leading indicators such as the ISM Manufacturing Survey.
Even more so, further economic weakness and weakness in the US labor market should pressure the Fed into pausing its tightening efforts and ultimately commencing a new monetary policy easing cycle which would be a significant tailwind for cryptoassets going forward.
Bottom Line: Increasing US sovereign risks in light of the debt ceiling and De-Dollarization take center stage at the macro front. Significant Dollar weakness would be a strong tailwind for cryptoassets, in particular Bitcoin.
The US recession narrative should gradually fade as a headwind as it appears to be “baked in the cake” at the moment and because of the fact that equity markets have historically bottomed with a trough in leading indicators which would also be positive for cryptoasset markets. Further economic weakness would also pressure the Fed to pause and ultimately commence a new easing cycle which would be a significant tailwind for cryptoasset prices.
On-Chain Analytics
Probably the biggest event in April from an on-chain perspective was the Shapella Upgrade by the Ethereum network that happened on the 12/04/2023.
We have written an extensive piece on the ins and outs of this upgrade, so make sure to read it, if you have not done so already (see here).
The upgrade itself served as a catalyst to catch up on the underperformance that Ethereum had delivered vis-à-vis Bitcoin just right before the upgrade in 2023. As derivatives traders unwound their downside hedges after the successful upgrade, Ethereum was able to outperform Bitcoin again.
But the Ethereum upgrade also served as a wider catalyst for a what appears to be a new “Altseason” – a market environment where cryptoassets ex Bitcoin begin to significantly outperform Bitcoin.
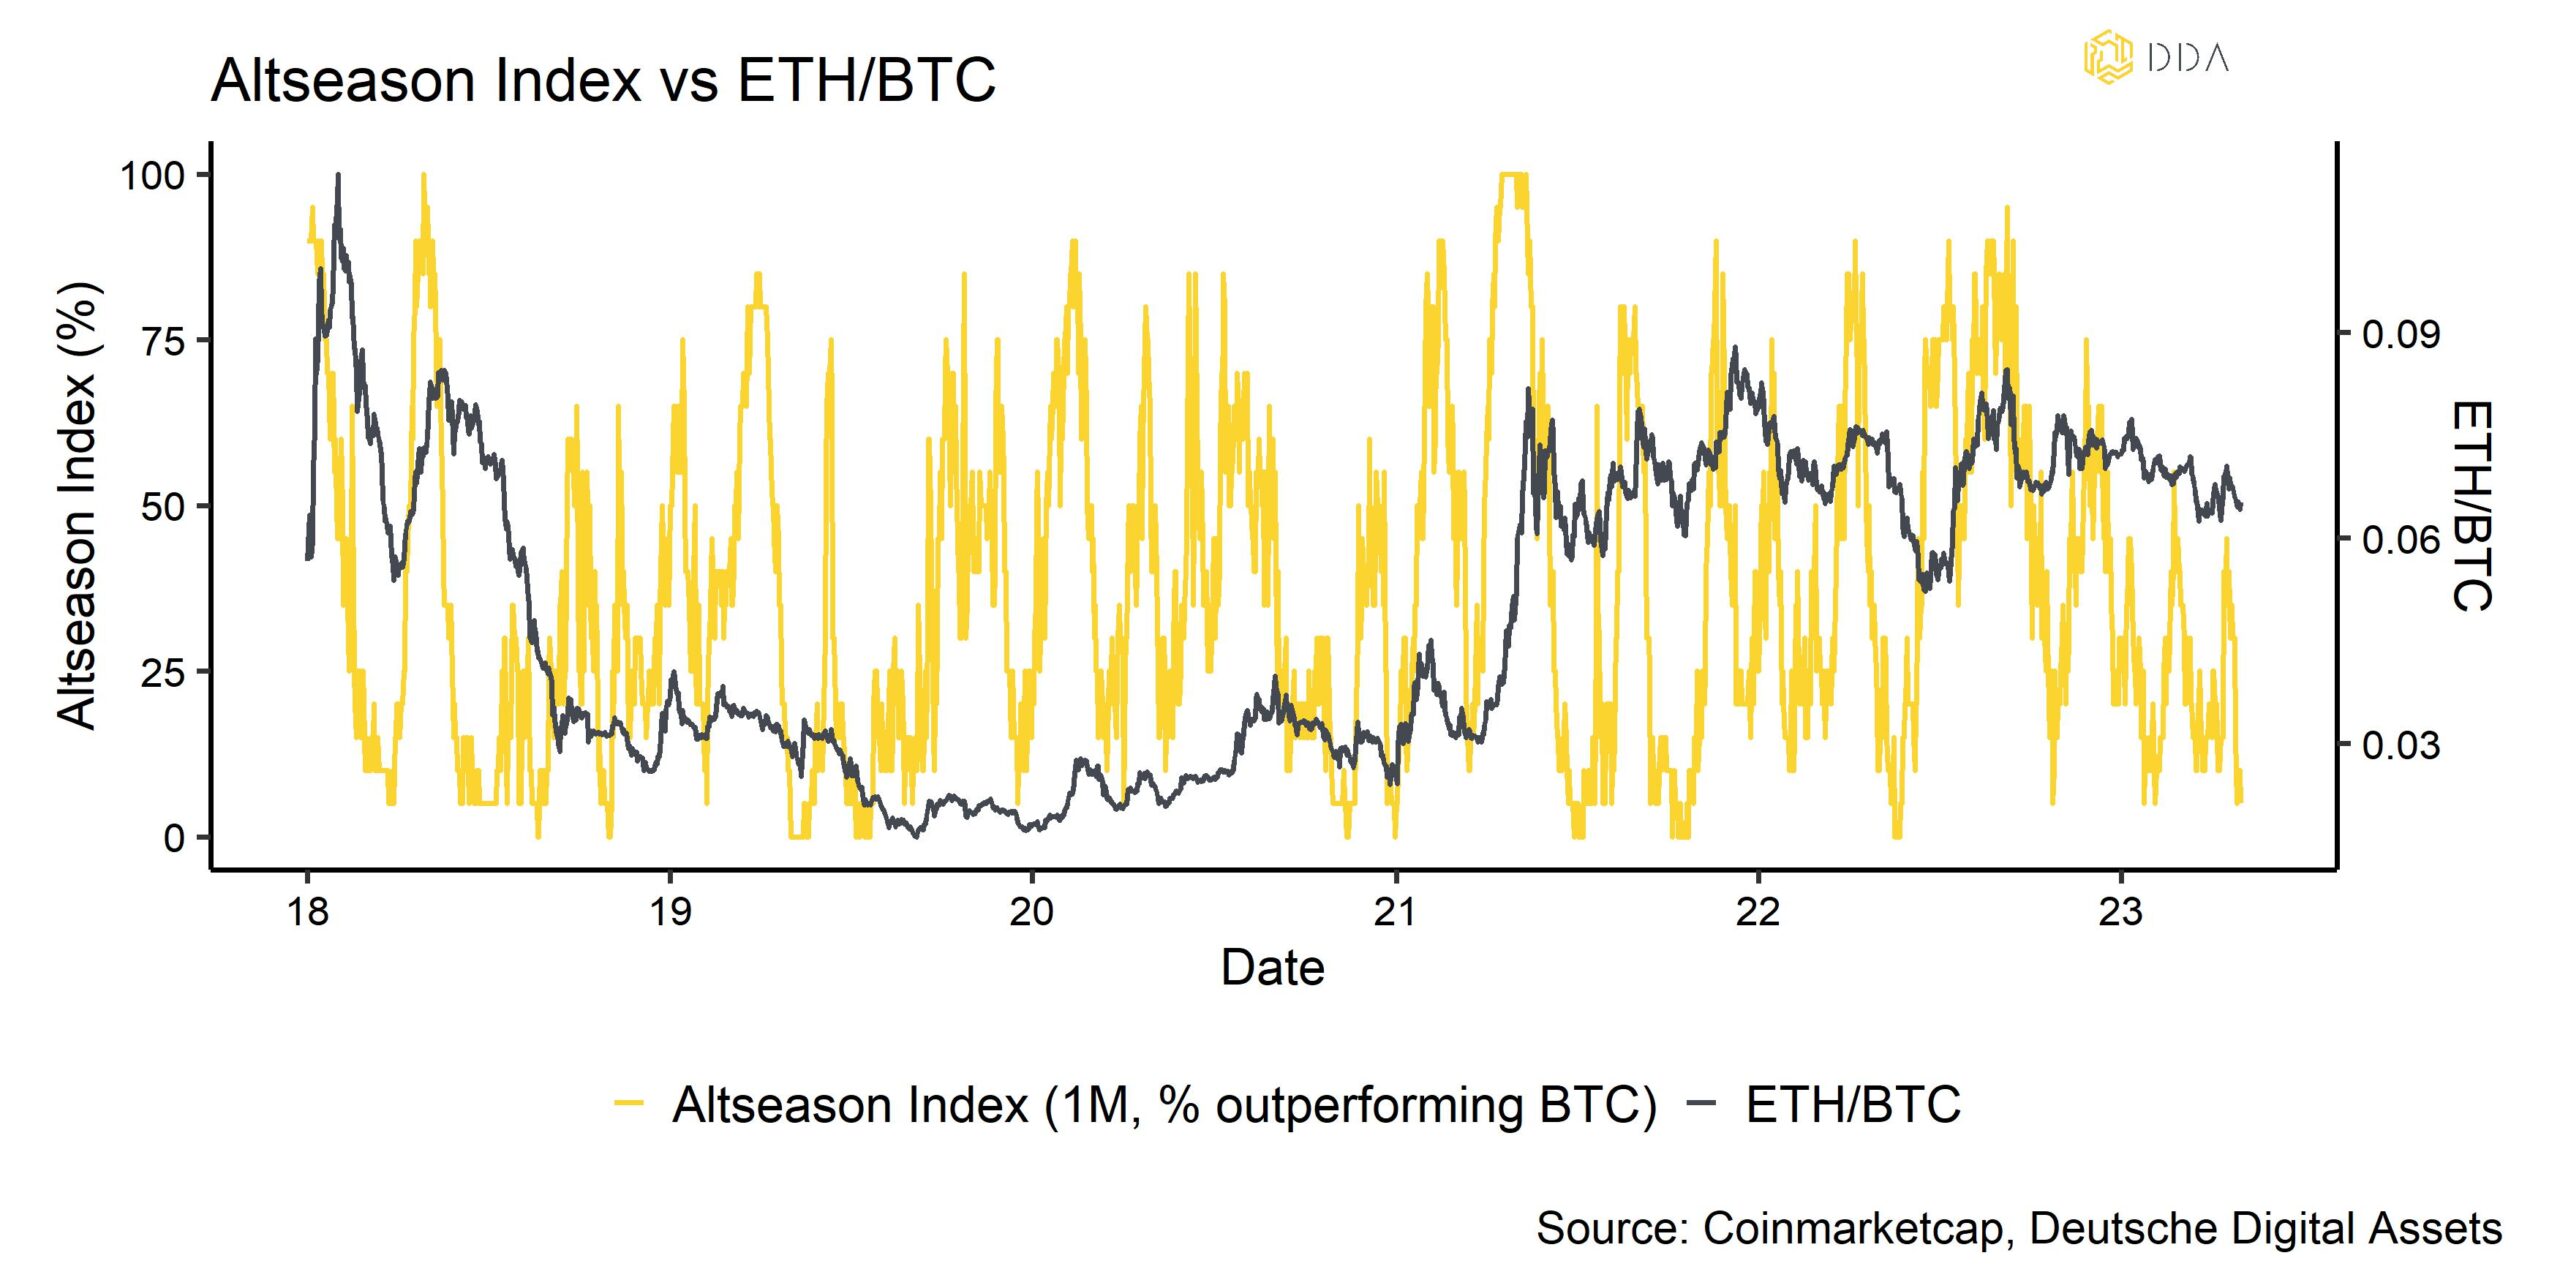
2023 was so far characterized by a significant outperformance of Bitcoin but we have seen some first evidence of this outperformance ending. Right after the upgrade, our Altseason Index signalled that the majority of our tracked altcoins were able to outperform Bitcoin on a 1-week basis.
At the same time, core on-chain metrics for Bitcoin remain very solid which should continue to support overall cryptoasset markets going forward.
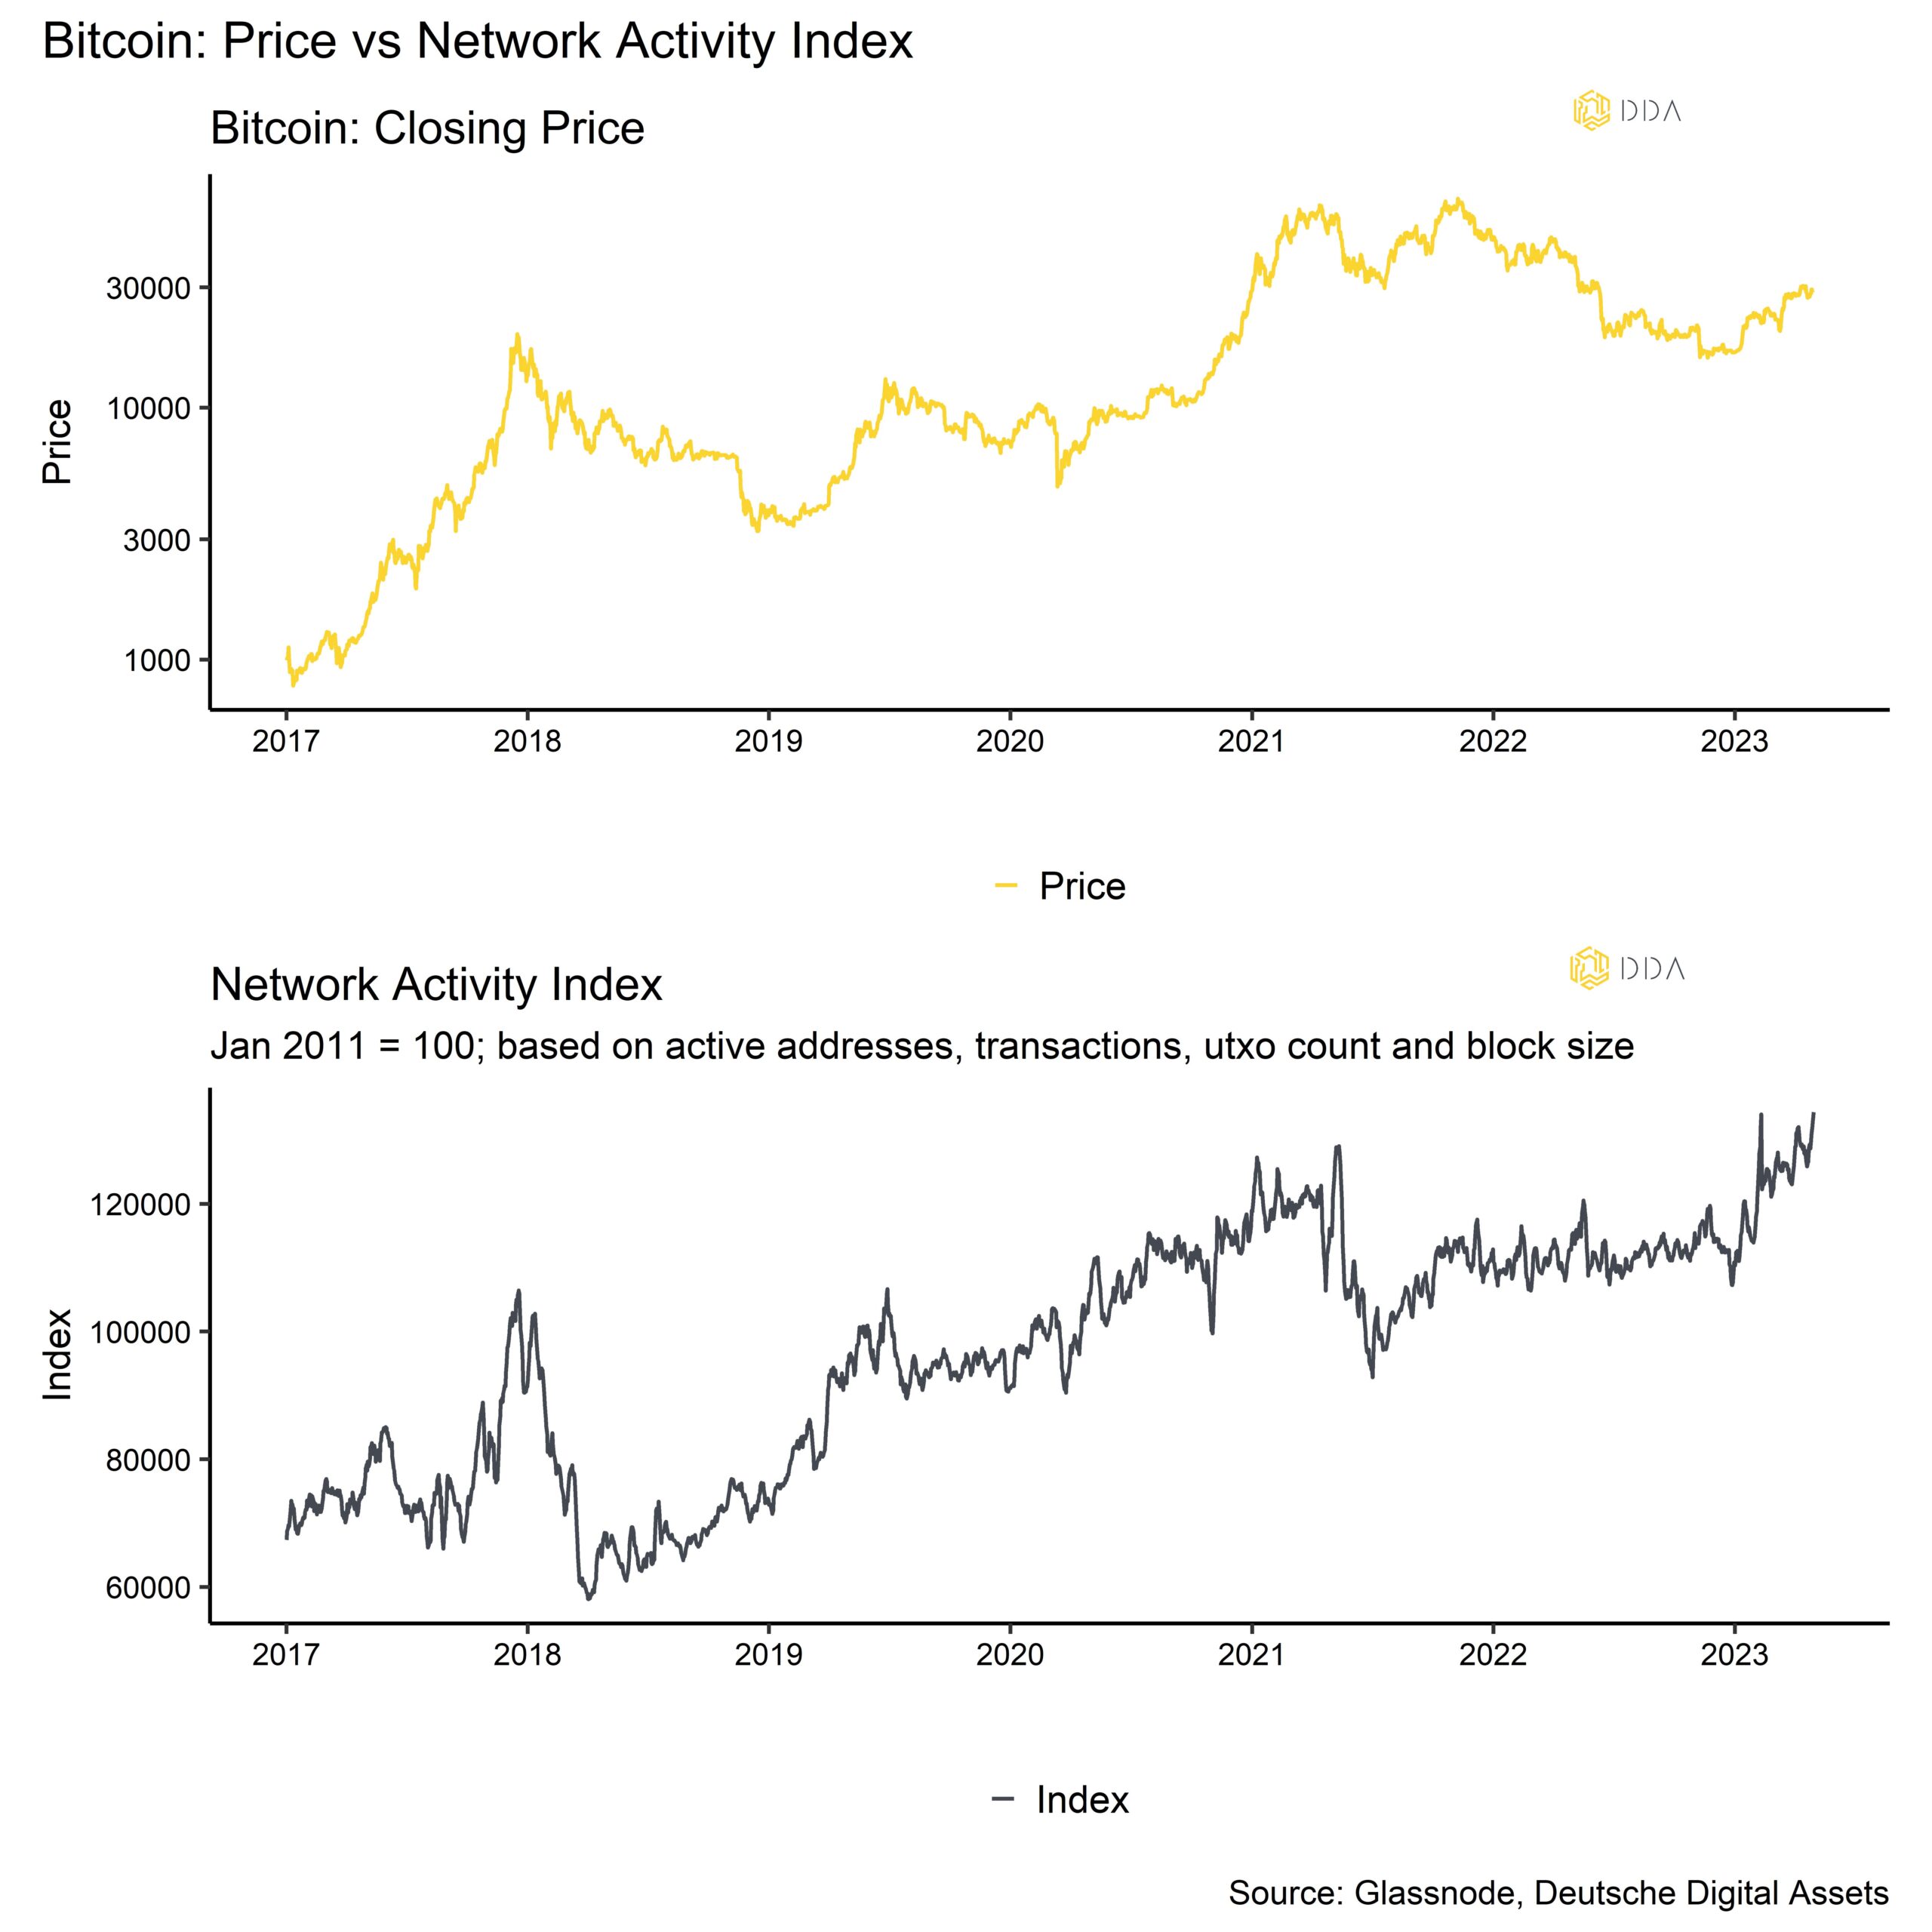
For instance, the total transfer volume on the Bitcoin blockchain reached a new all-time high over the weekend (see Chart-of-the-month). In other words, there have never been more transactions on the Bitcoin blockchain than now. The fact that this has happened at a time when the US government has brokered a bailout of First Republic Bank and JP Morgan is probably just a funny coincidence.
Our in-house Bitcoin network activity index also signals that overall network activity on the base layer remains at the highs seen during the last bull market in mid-2021.
One of the reasons is that the volume of inscriptions is still increasing with the daily number of new inscriptions on the Bitcoin blockchain reaching the highest level ever recorded on the 24/04/23 with almost 200k new inscriptions in a single day. Most of these inscriptions were text type inscriptions which is why this did not have a significant influence on block size.
At the time of writing, approximately 1.7 mn inscriptions have taken place on the Bitcoin blockchain, with the majority of these inscriptions being of the text (~1.05 mn) and image type (~0.649 mn) according to data compiled by Glassnode.
It is interesting to note that the latest spike in the volume of inscriptions reached an average of 40% of all transactions (ie 4 out of 10 transactions contained an inscription) but only 20% average share of the block size.
In contrast, Bitcoin accumulation appeared to be rather muted. The weakness in price following the timing of the Ethereum upgrade was most-likely also a result of that. In fact, our in-house measure of weighted accumulation activity across all Bitcoin wallet cohorts fell to the lowest level year-to-date.
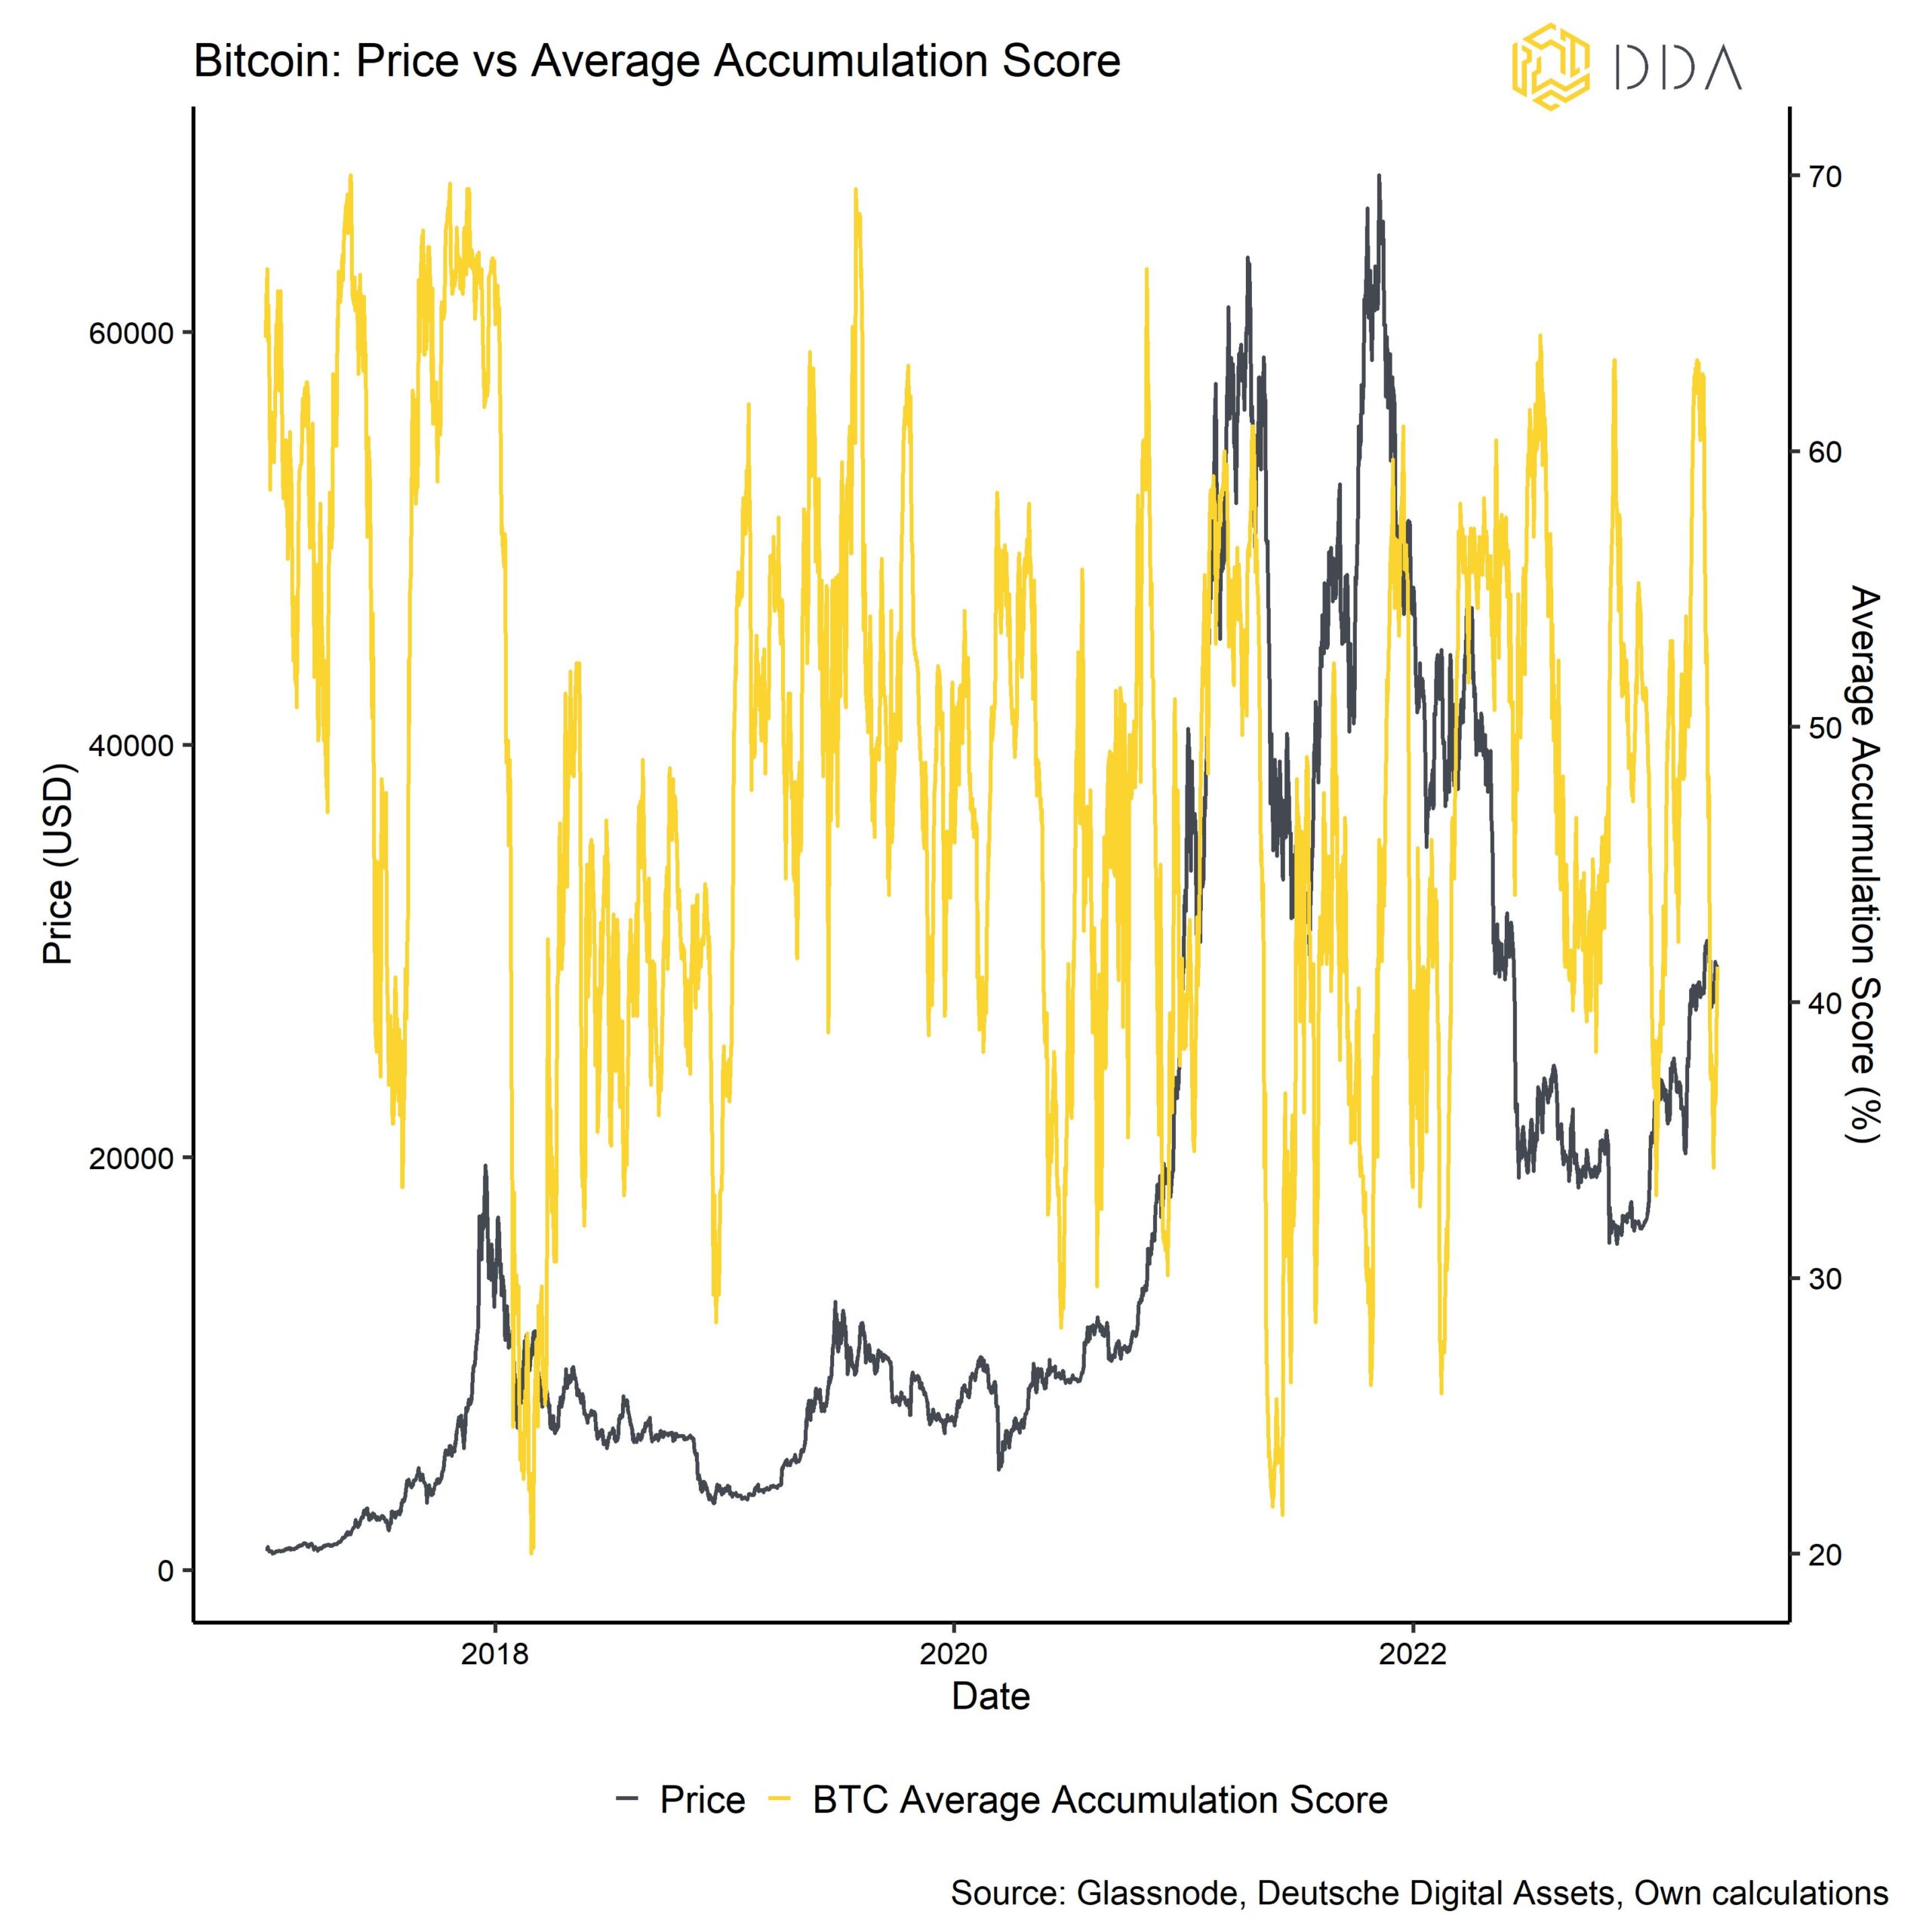
That being said, very low levels should be rather seen as a contrarian buying signal from our point of view.
But the key takeaway is that while core on-chain metrics for Bitcoin such as total transfer volume still appear to be solid, accumulation activity for Bitcoin appears to have weakened in April.
This view is also corroborated by the fact that Bitcoin exchange balances have slowly creeped up in April which implies net exchange inflows that usually increase selling pressure. At the same time, exchange balances for Ethereum have continued to decline and reached multi-year lows.
However, from a valuation perspective, our in-house composite Bitcoin valuation indicator that incorporates 7 different valuation metrics is currently around the 48% percentile based on our calculations while Ethereum valuations are already around the 65% percentile.
Thus, based on its own historical valuations, Ethereum appears to be slightly more expensive than Bitcoin now but both cryptoassets’ valuations are still attractive and do not signal overvaluation, yet.
Our in-house bottom probability model for Bitcoin also now clearly suggests that the worst is behind us and that a new bull market cycle has most-likely commenced:

That being said, the historical performance path for Bitcoin suggests that the time to new all-time highs could very well be more than a year away. According to the historical drawdowns of the past 3 bear cycles, you could assume new all-time highs for Bitcoin to be made in October 2024 which would also be consistent with the halving that is about to take place in April 2024.
So far, the price of Bitcoin has been tracking the median recovery path of the last 3 cycles rather closely:
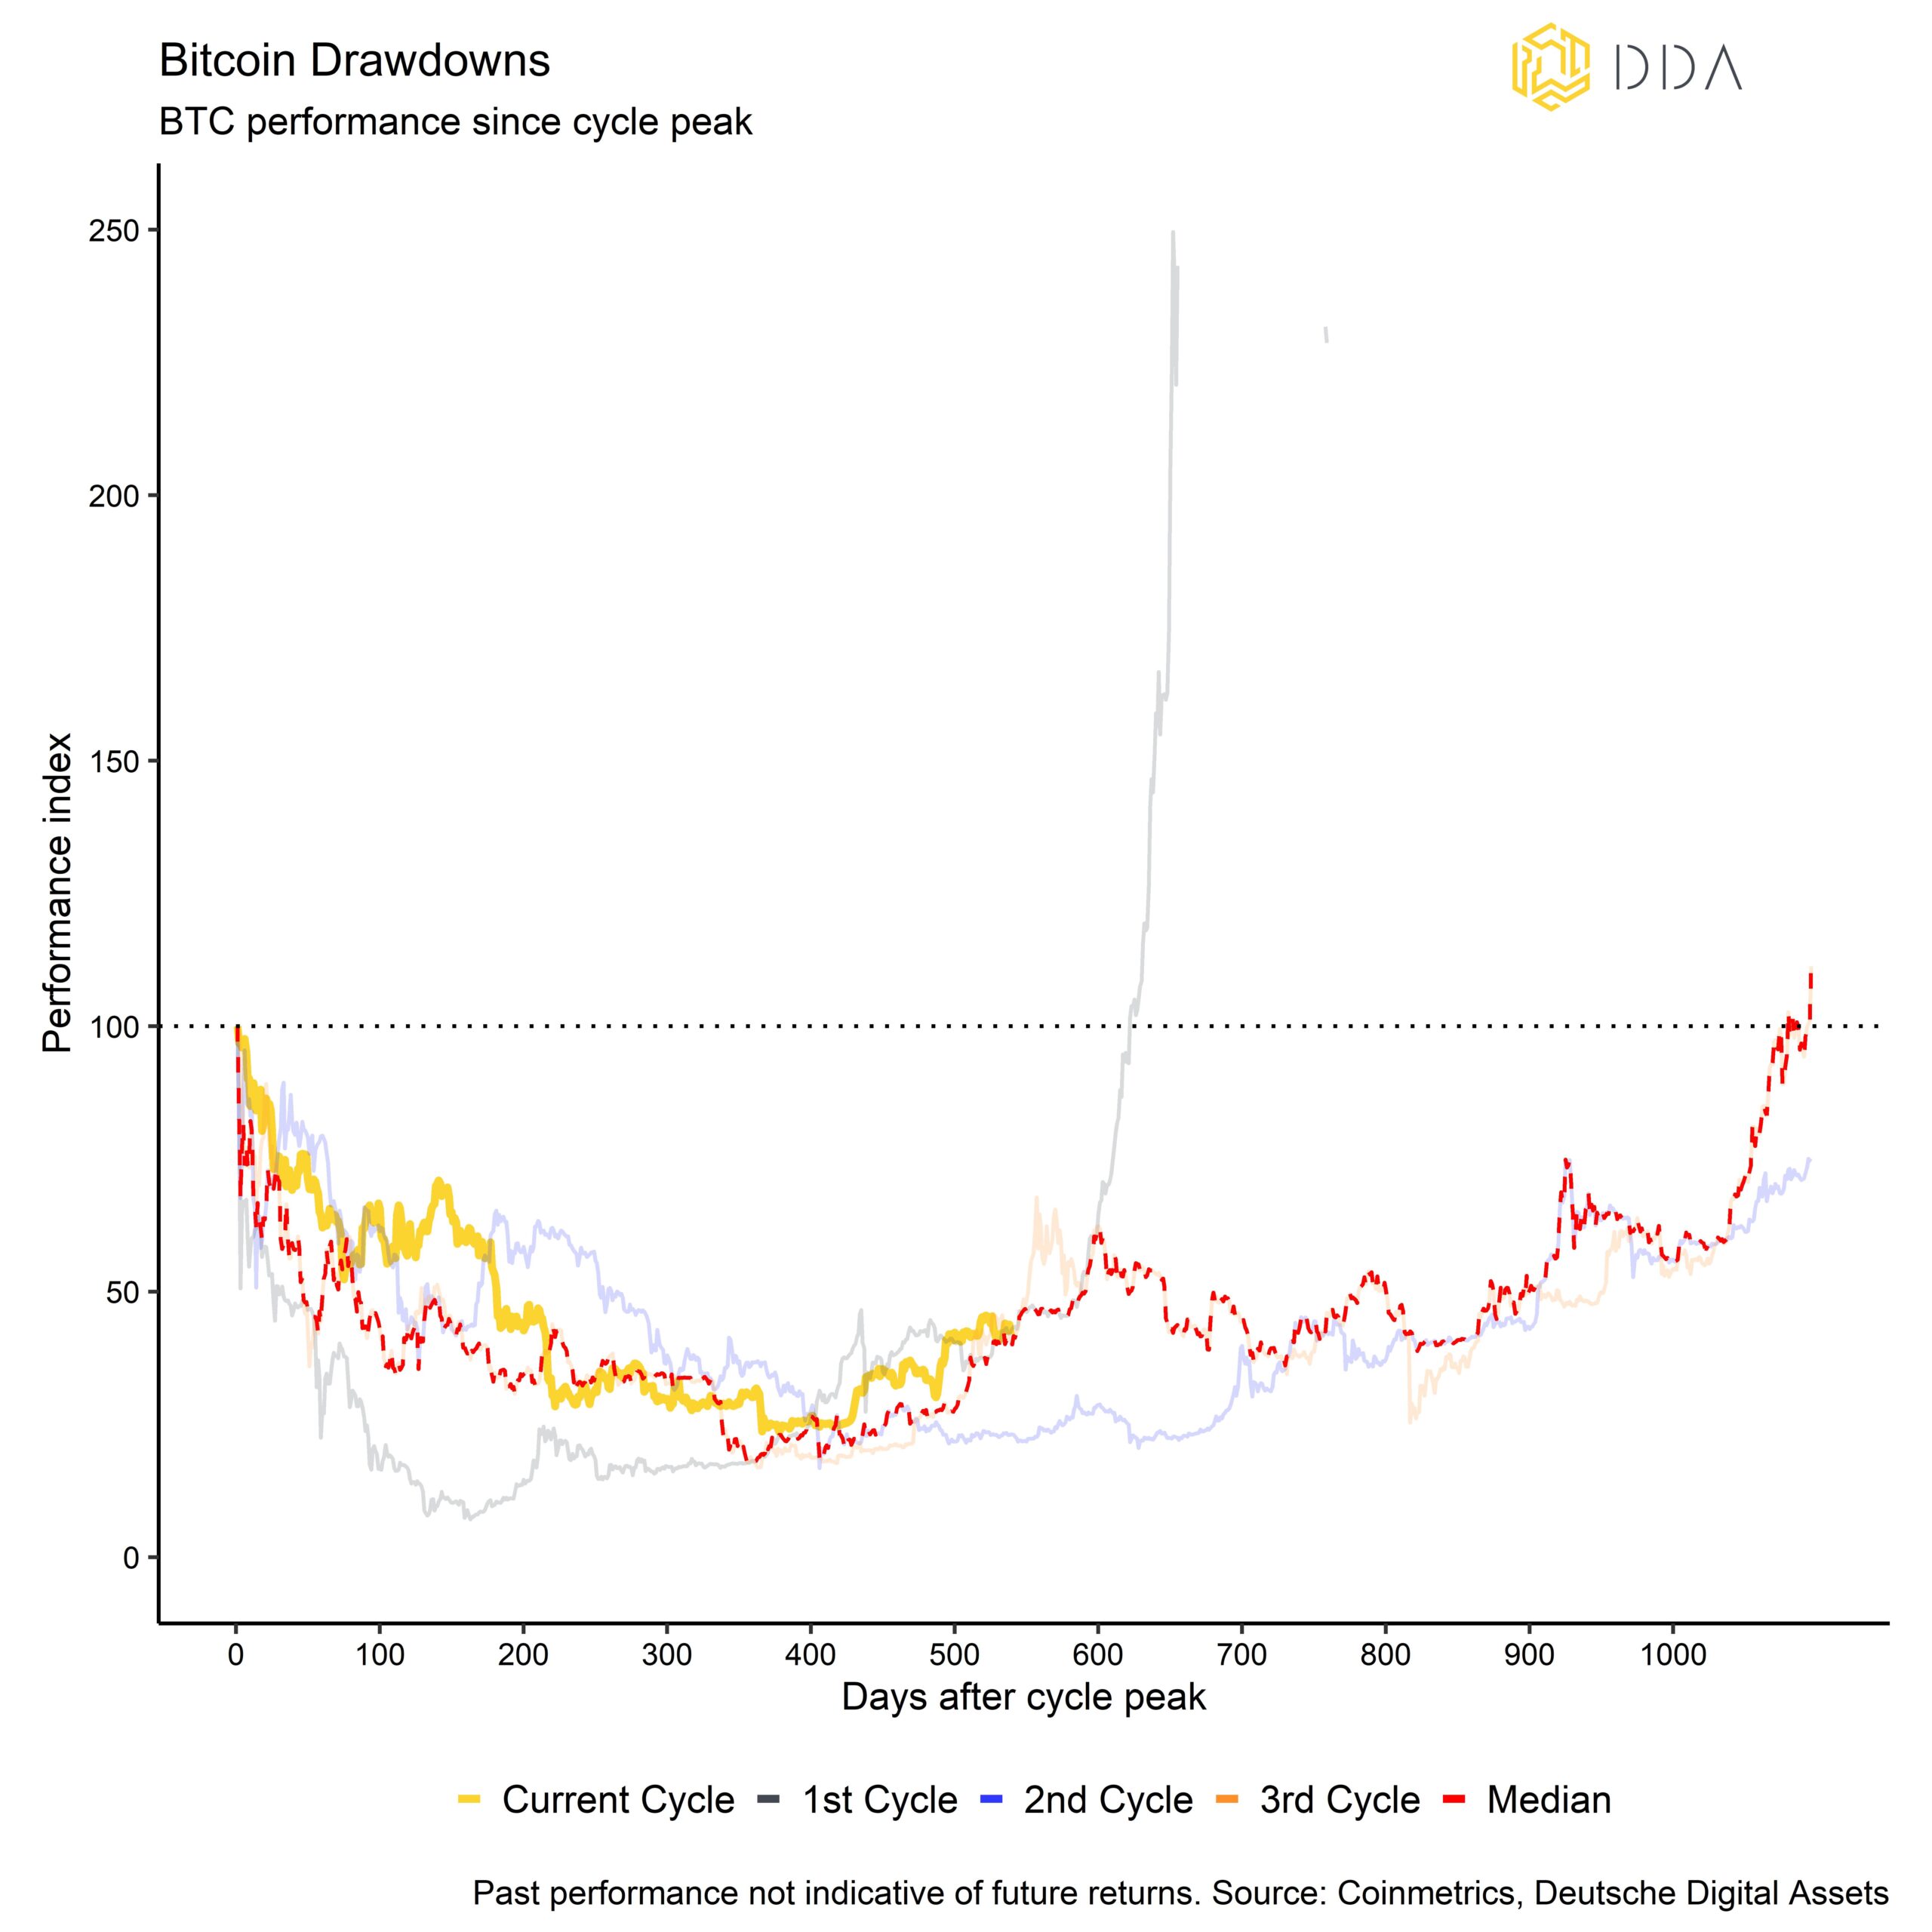
Our base case is that cryptoasset prices will not revisit the bear market cycle lows from November 2022 and that the bear market is most-likely over but that new all-time highs are not imminent in the short term either.
Speaking of historical performance patterns, we have recently published a short piece on Bitcoin seasonality. So, make sure to read it if you have not done so already (see here).
Among other findings, the abovementioned seasonality analysis implies that investors should at least hold on to their positions into the summer months as May and June have historically exhibited above-average returns for Bitcoin in the past.
Bottom Line: The Ethereum Shapella Upgrade could have served as a catalyst for a more broad-based “Altseason” – a market environment where cryptoassets ex Bitcoin tend to outperform. On-chain indicators for Bitcoin imply solid network activity due to the ongoing inscription saga but also weakening accumulation activity in April.
Exchange balances for Bitcoin have slowly increased while exchange balances for Ethereum have continued to decrease. Our base case is that cryptoasset prices will not revisit the bear market cycle lows from November 2022 and that the bear market is most-likely over but that new all-time highs are not imminent in the short term either.
About Deutsche Digital Assets
Deutsche Digital Assets is the trusted one-stop-shop for investors seeking exposure to crypto assets. We offer a menu of crypto investment products and solutions, ranging from passive to actively managed exposure, as well as financial product white-labeling services for asset managers.
We deliver excellence through familiar, trusted investment vehicles, providing investors the quality assurances they deserve from a world-class asset manager as we champion our mission of driving crypto asset adoption. DDA removes the technical risks of crypto investing by offering investors trusted and familiar means to invest in crypto at industry-leading low costs.
Legal Disclaimer
The material and information contained in this article is for informational purposes only. Deutsche Digital Assets, its affiliates, and subsidiaries are not soliciting any action based upon such material. This article is neither investment advice nor a recommendation or solicitation to buy any securities. Performance is unpredictable. Past performance is hence not an indication of any future performance. You agree to do your own research and due diligence before making any investment decision with respect to securities or investment opportunities discussed herein. Our articles and reports include forward-looking statements, estimates, projections, and opinions. These may prove to be substantially inaccurate and are inherently subject to significant risks and uncertainties beyond Deutsche Digital Assets GmbH’s control. We believe all information contained herein is accurate, reliable and has been obtained from public sources. However, such information is presented “as is” without warranty of any kind.