
Download the Full Report in PDF
Key Takeaways
- Close to “peak hawkishness” of US monetary policy but risks remain to the downside in the short-term with a potential spike in volatility ahead.
- Increasing evidence of peak hawkishness is in our view the necessary condition for a sustained macro bottom in Bitcoin and cryptoassets in general
- On-chain metrics imply that overall selling pressure has receded, and long-term investors are still accumulating strongly as valuations are relatively cheap. Potential miner distribution may pose a near-term risk due to increasing revenue pressure
Chart of the month
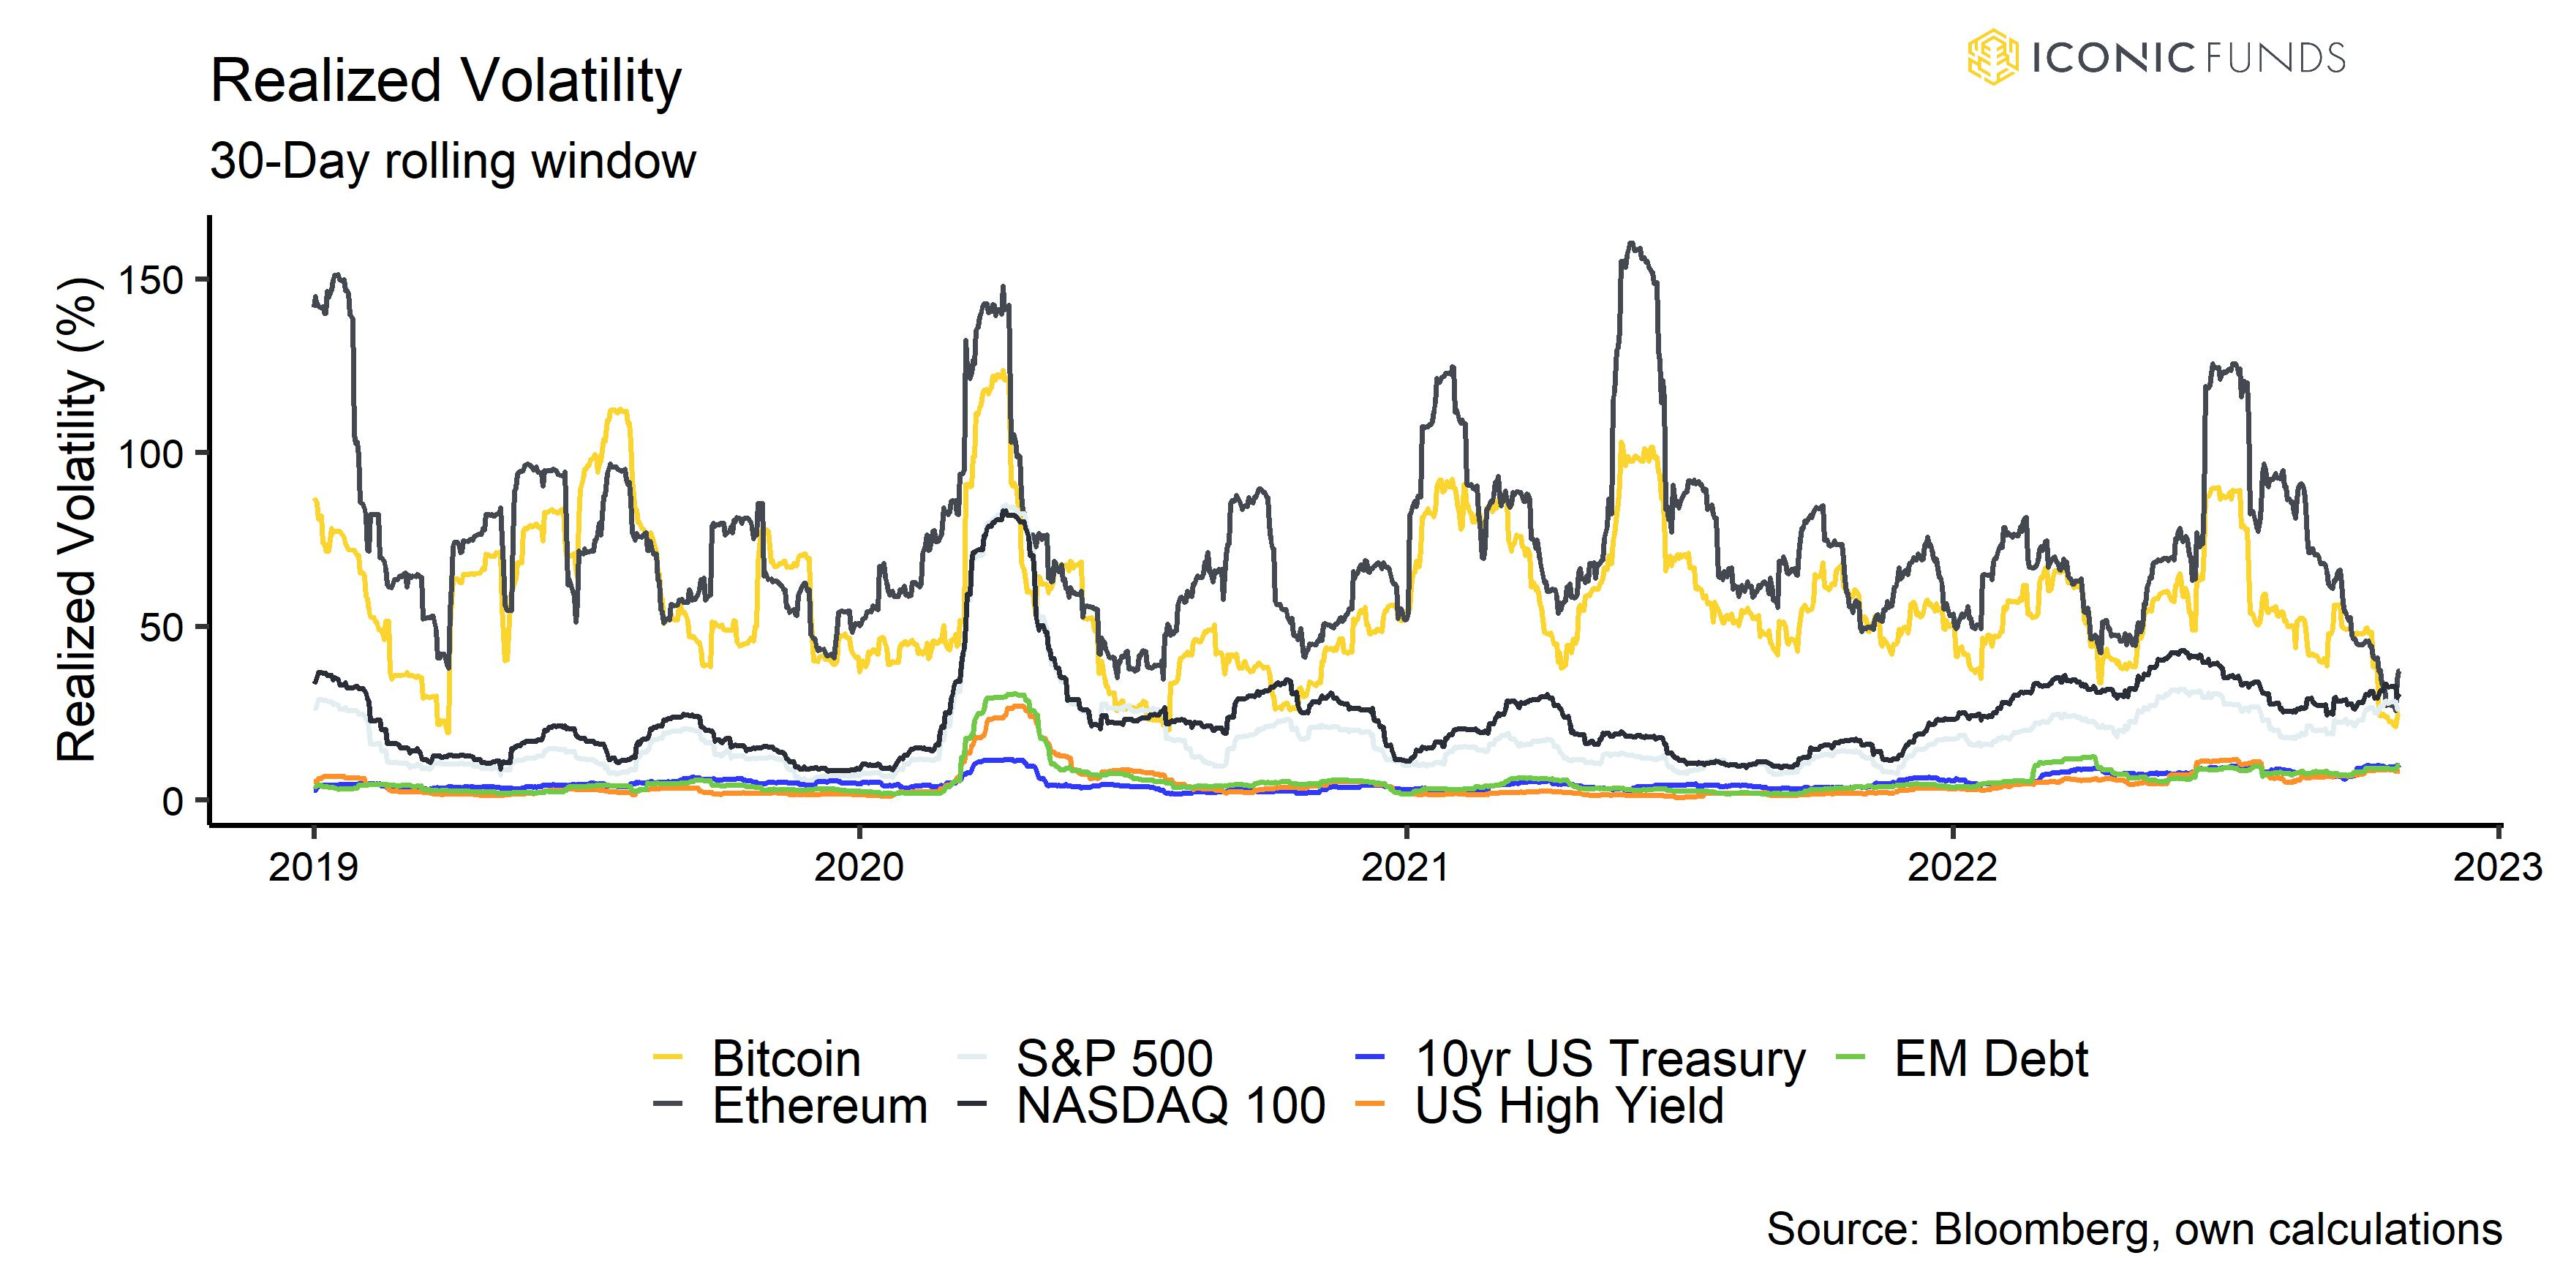
Performance Review
After a very turbulent September, October was a more mellow investment environment for cryptoassets as evidenced by our Chart of the Month. Realized and implied volatilities of cryptoassets have significantly declined due to the fact that Bitcoin & Ethereum were mostly mired in a sideways market. In fact, realized volatilities of Bitcoin & Ethereum have been lower than for US large cap equities in the last 30 trading days. Interestingly, the correlations of both Bitcoin and Ethereum to Gold and German government bonds have increased lately which have fueled speculation for Bitcoin quietly becoming a safe-haven asset (see Correlation Charts in appendix).
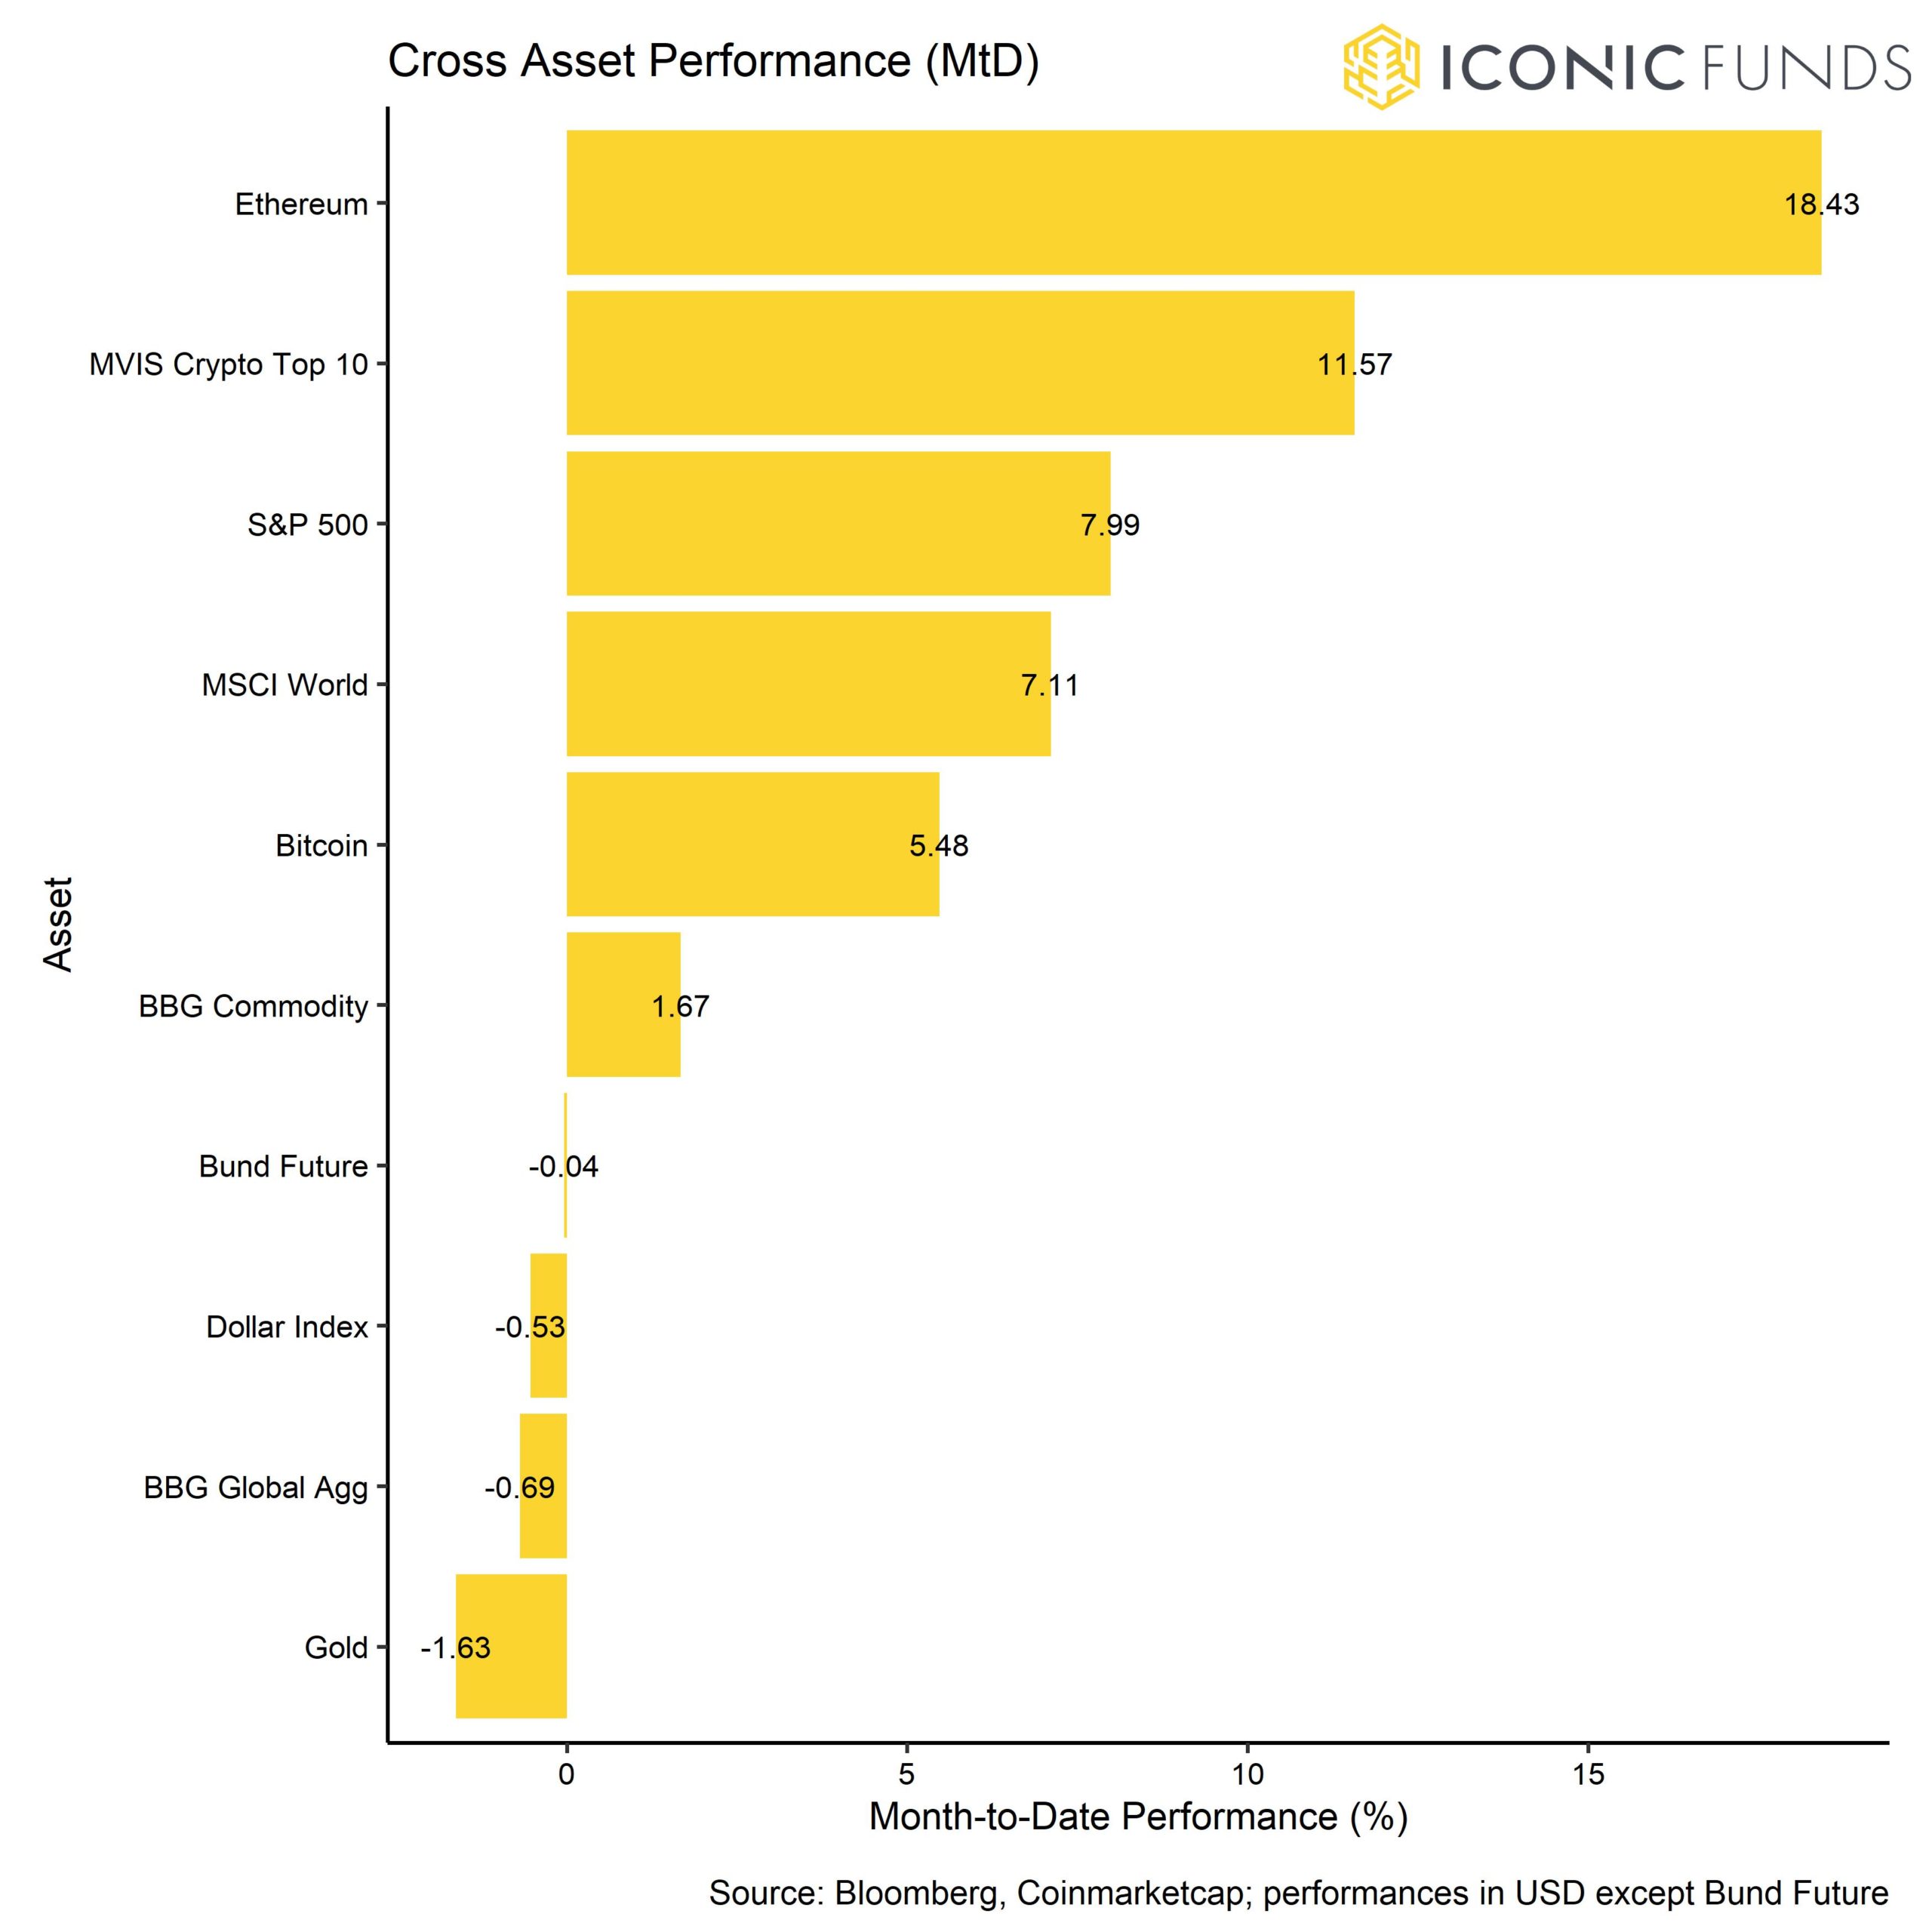
In general, capital markets have mostly stabilized due to the fact that there is increasing evidence for a more moderate pace of rate hikes going forward. This has particularly propelled equities and cryptoassets higher in October, while safer assets such as Gold and government bonds have continued to underperform:
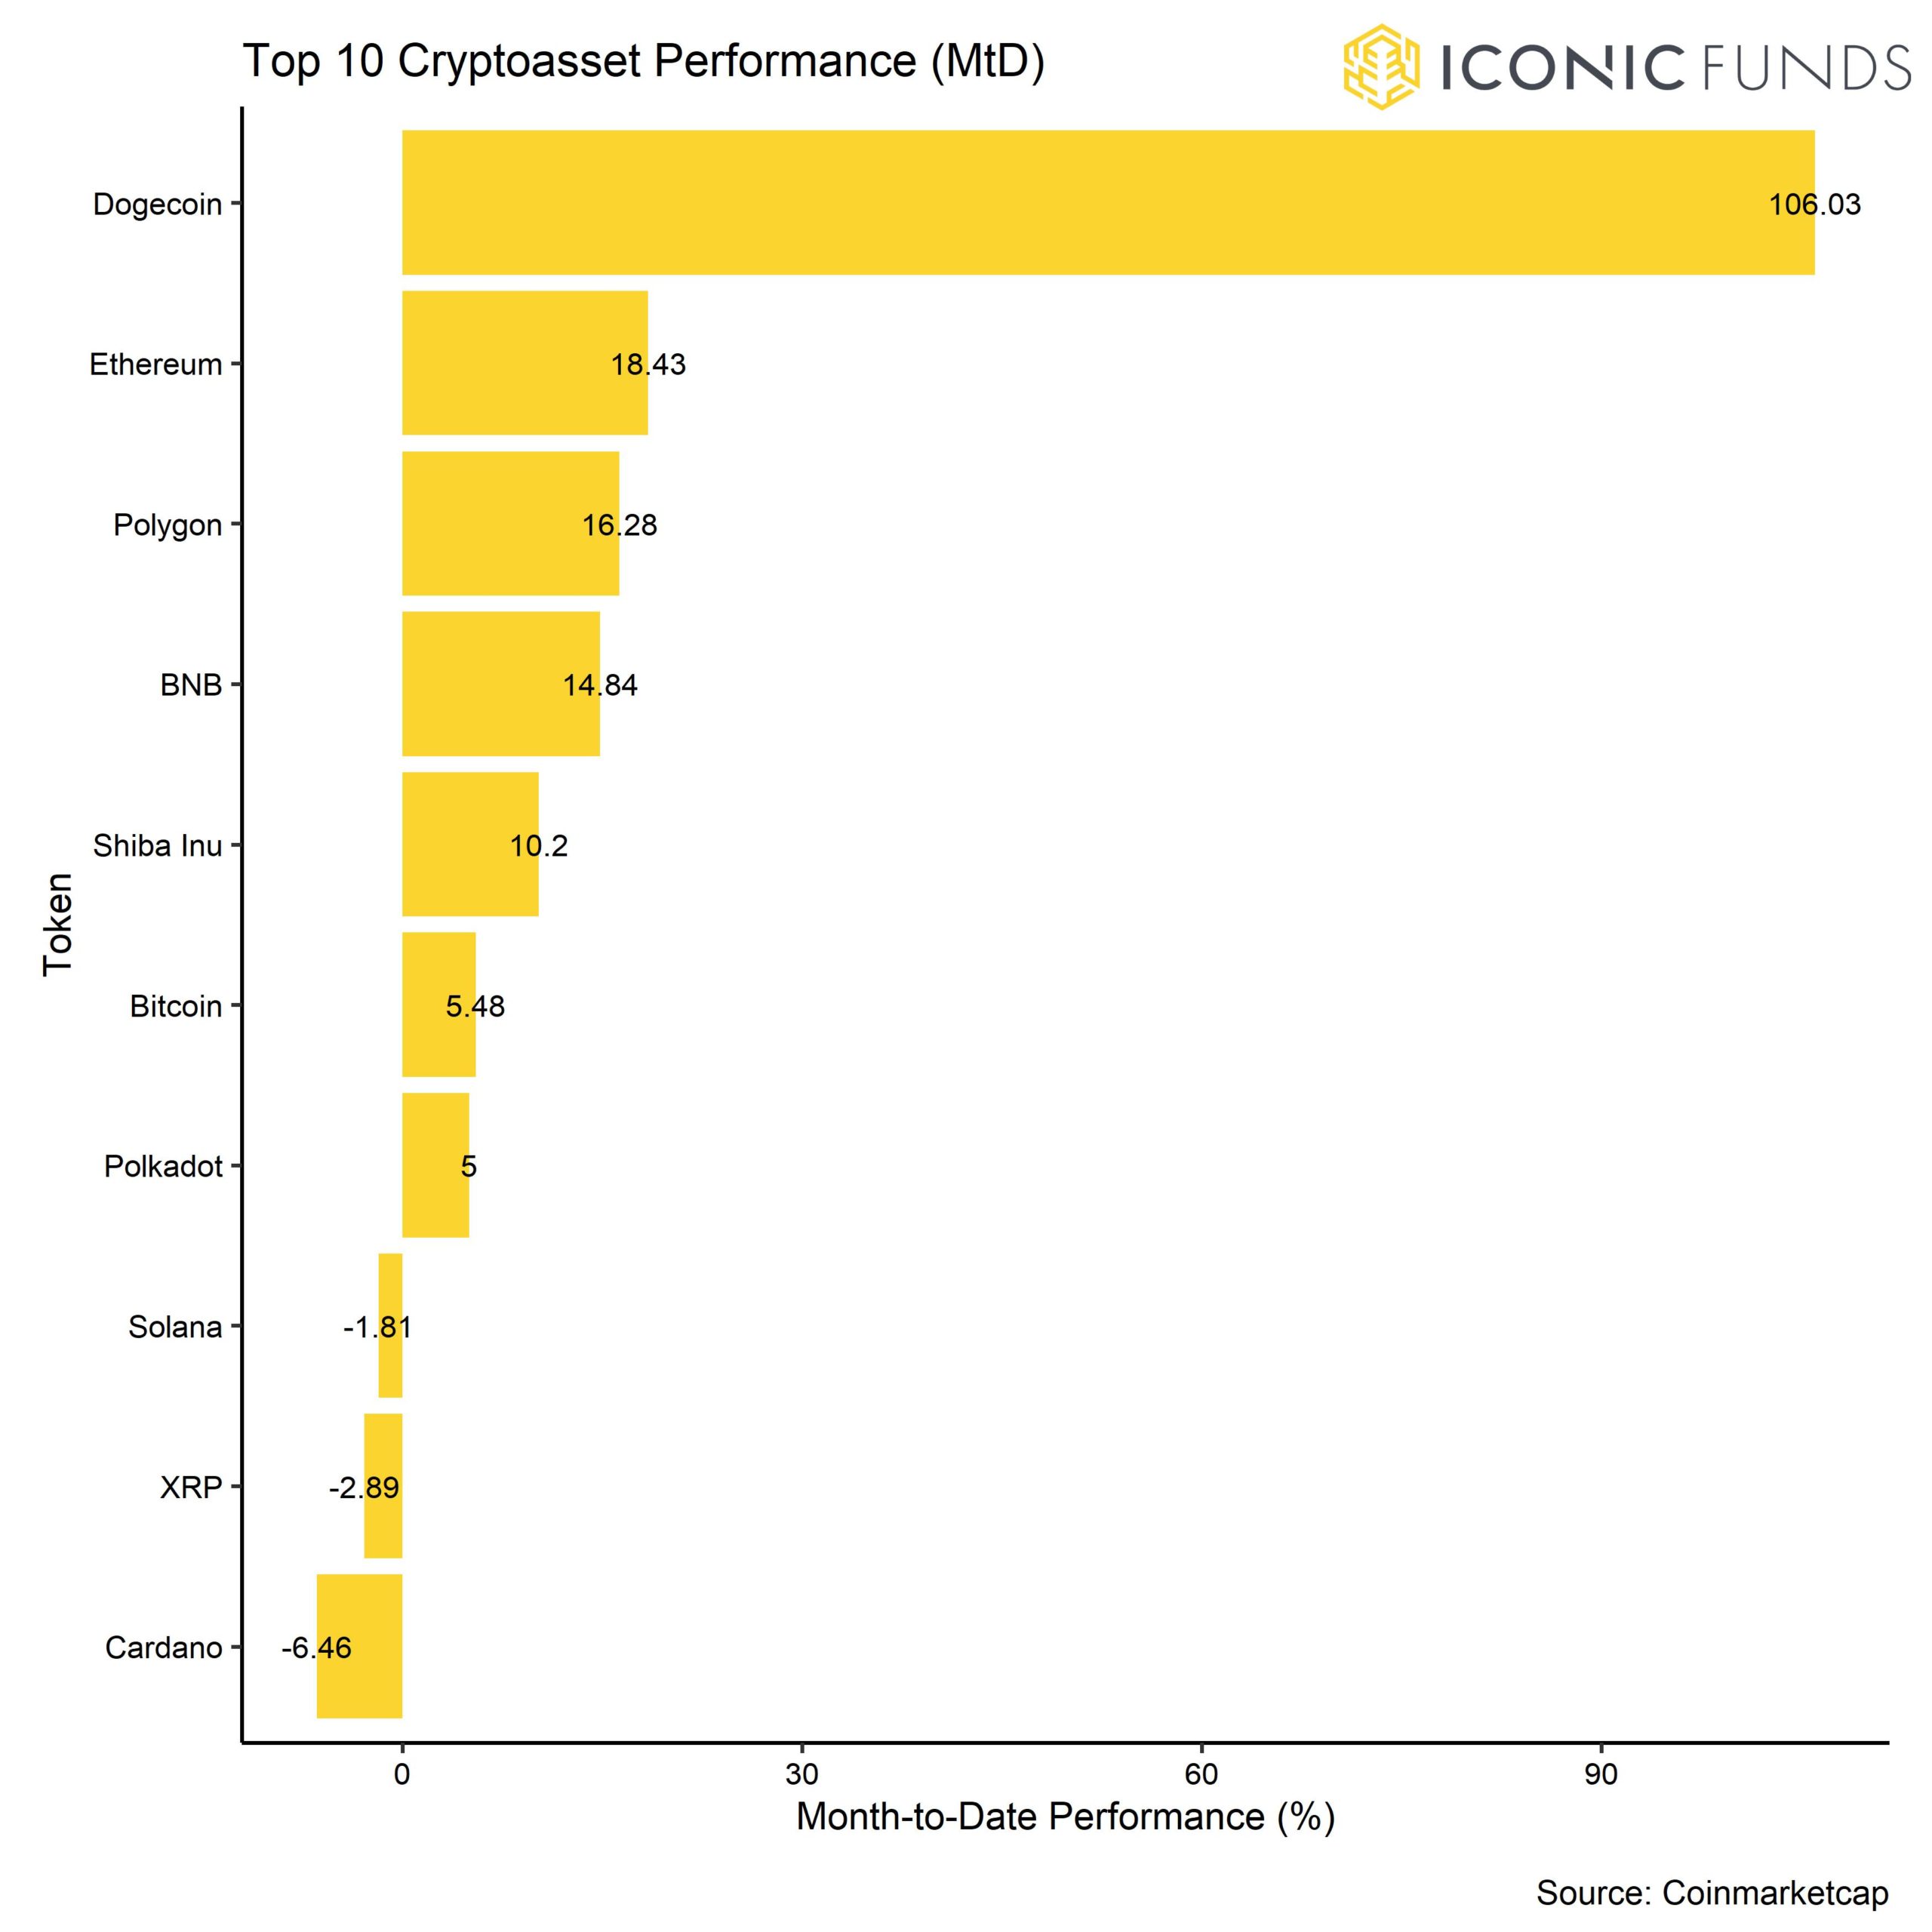
Among the top 10 major cryptoassets, Dogecoin, Polygon and Ethereum have been the main outperformers. Dogecoin tokens rallied due to the final takeover of Twitter by Elon Musk and the speculation that he might expand payments using the meme coin. Polygon tokens rallied on account of the news that NFT volumes on Polygon have spiked following an increasing usage of collectible avatars on the social media platform Reddit.
Overall risk appetite for altcoins was relatively low judging by our proprietary Altseason Index (see Appendix). Only 20% of the major Altcoins tracked by the index managed to outperform Bitcoin over the month.
Our proprietary Crypto Dispersion Index implies that cryptoasset performances were mainly driven by idiosyncratic/crypto-specific factors rather than systematic factors in the last 30 days. A high reading of the Crypto Dispersion Index implies that average pairwise correlations between Altcoins and Bitcoin are low.
Bottom Line: Performances have stabilized in October due to increasing evidence of a more moderate pace of rate hikes. Cryptoasset volatility has declined below US equity volatility as the market has mostly been trading sideways. The level of dispersion among cryproassets remains high but Altcoins mainly underperformed Bitcoin in the last month.
Macro & Markets Commentary
All in all, risks are still tilted to the downside in the short-term. In our view, the key to a sustained stabilization in crypto markets and capital markets in general remains a clear pivot in monetary policy by the Federal Reserve.
In our recent research deep dive (“View from the Citadel”), we have tried to disentangle the main macro drivers for cryptoassets and particularly Bitcoin. The main conclusion of this analysis was that recent changes in the price of Bitcoin were mainly associated with changes in global monetary policy expectations (for further insights, please follow this link). Thus, we assume that monetary policy and tight financial conditions remain the dominant (negative) macro driver in the short- to medium term for Bitcoin and cryptoassets in general.
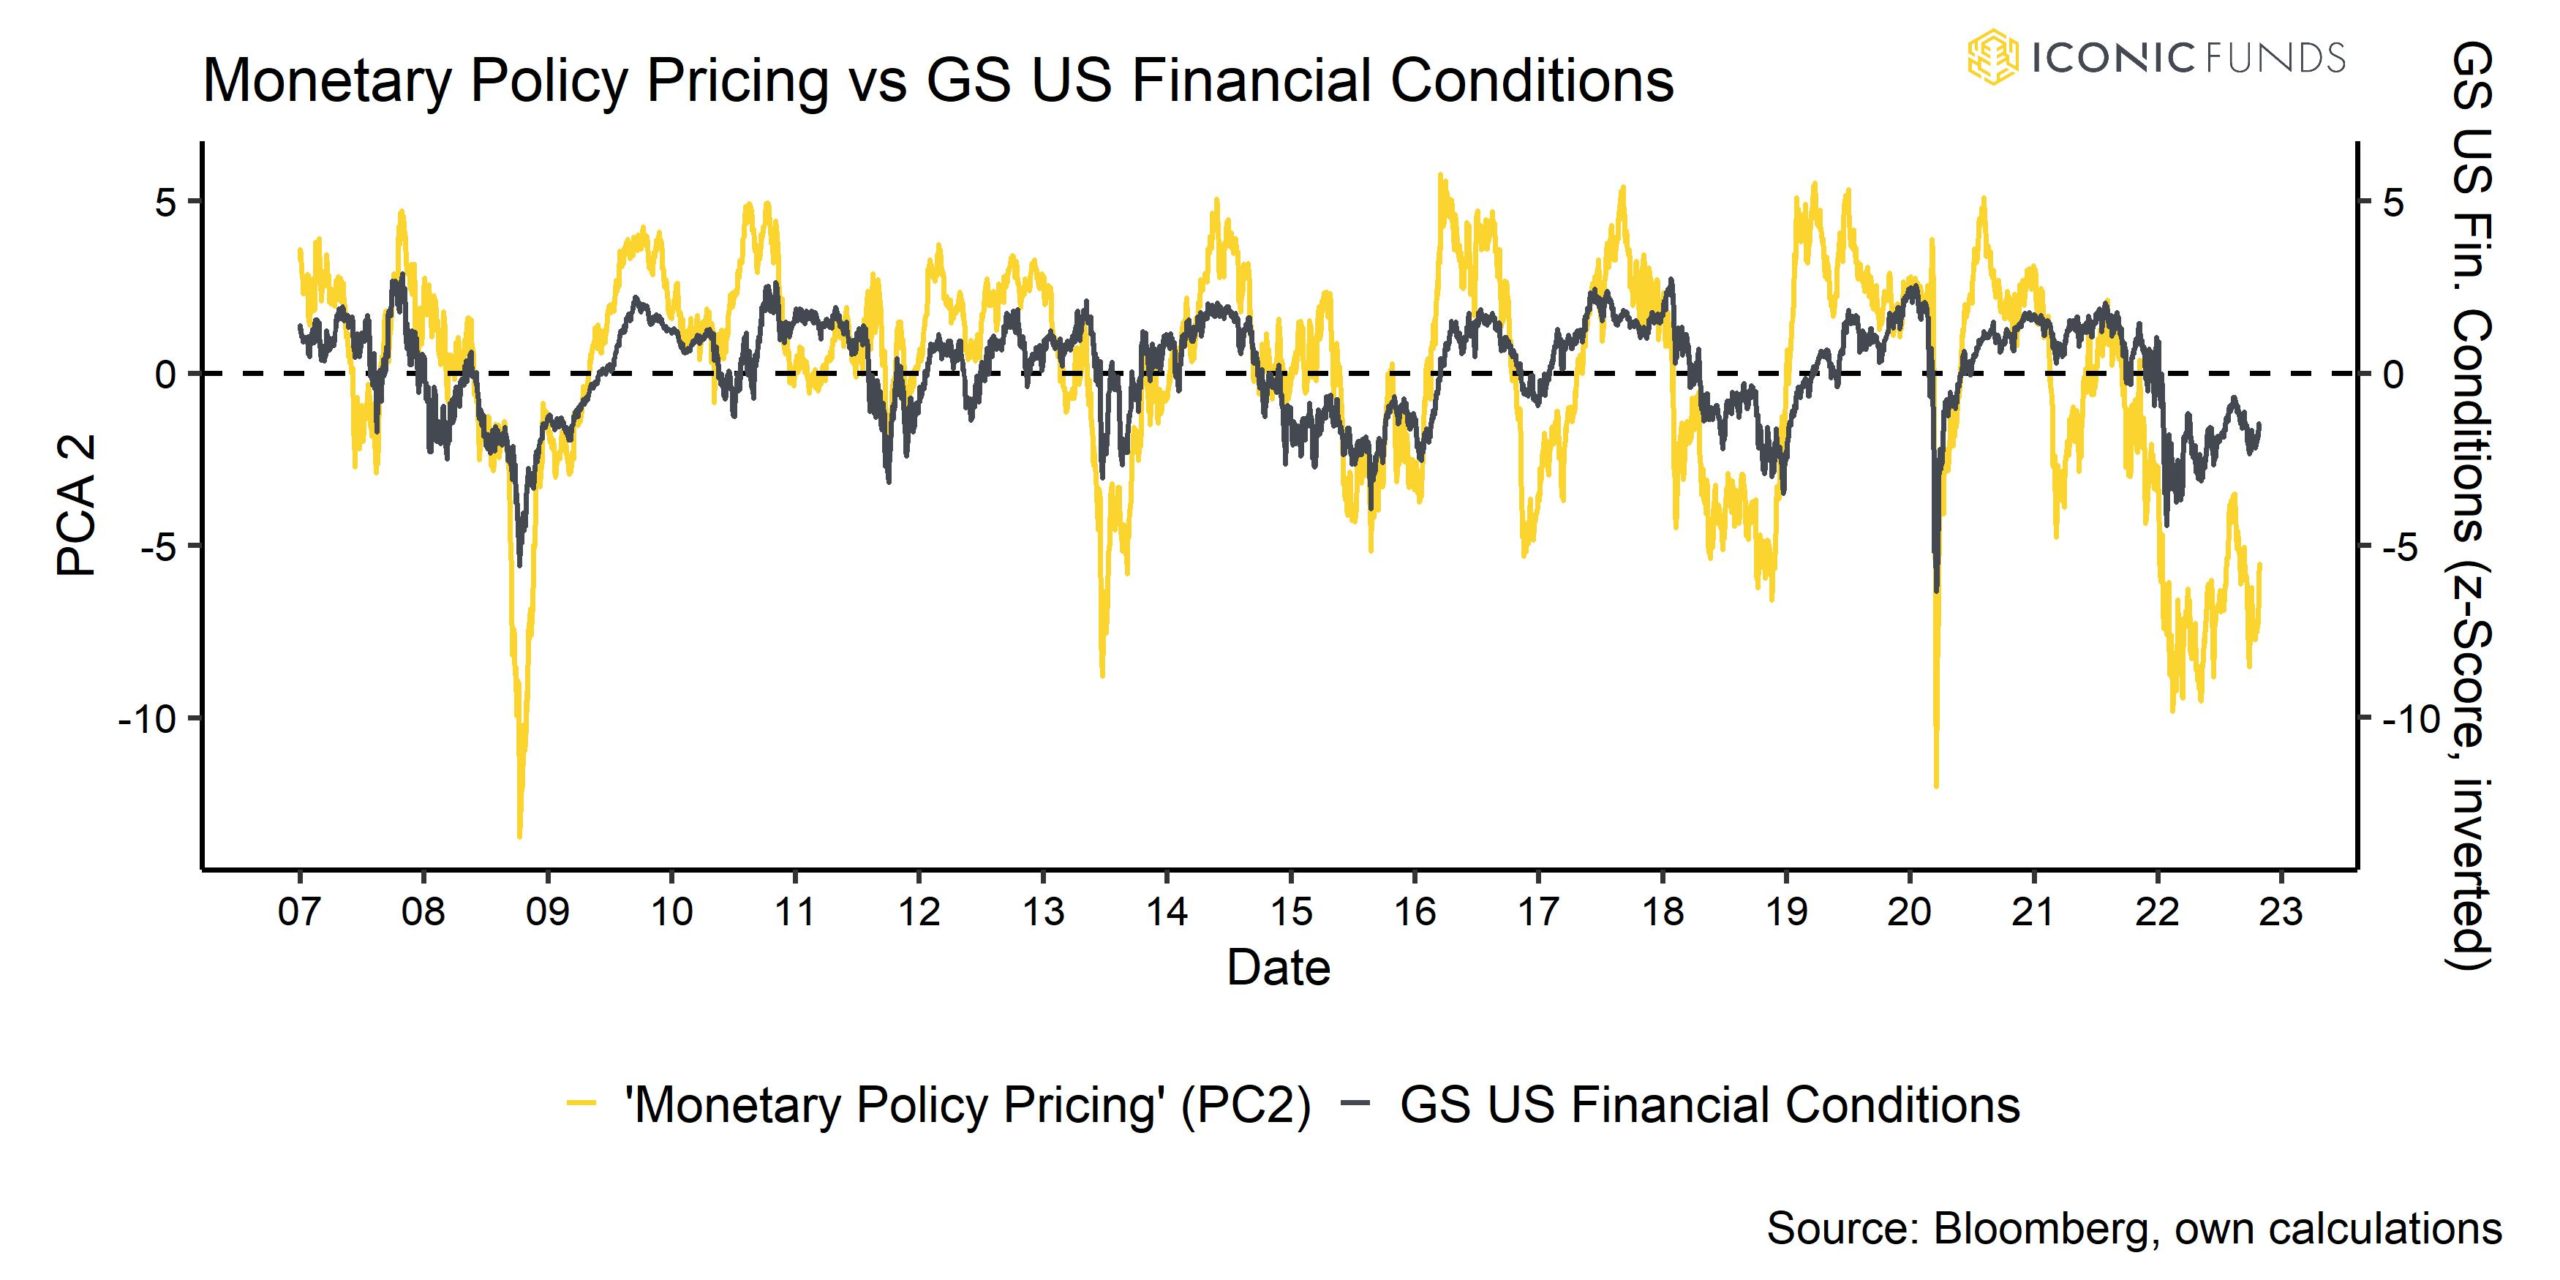
Nonetheless, macro factors as we measure them are by design mean-reverting which implies that very low readings, as we are observing now, are likely to revert to more neutral and ultimately positive levels in the future.
In fact, the degree of monetary policy tightening is so high that we expect to reach “peak hawkishness” of US monetary policy rather sooner than later. The moment we will reach peak hawkishness of US monetary policy might provide an environment for a more sustainable macro bottom in cryptoasset prices going forward. This view is also depicted in the following table:
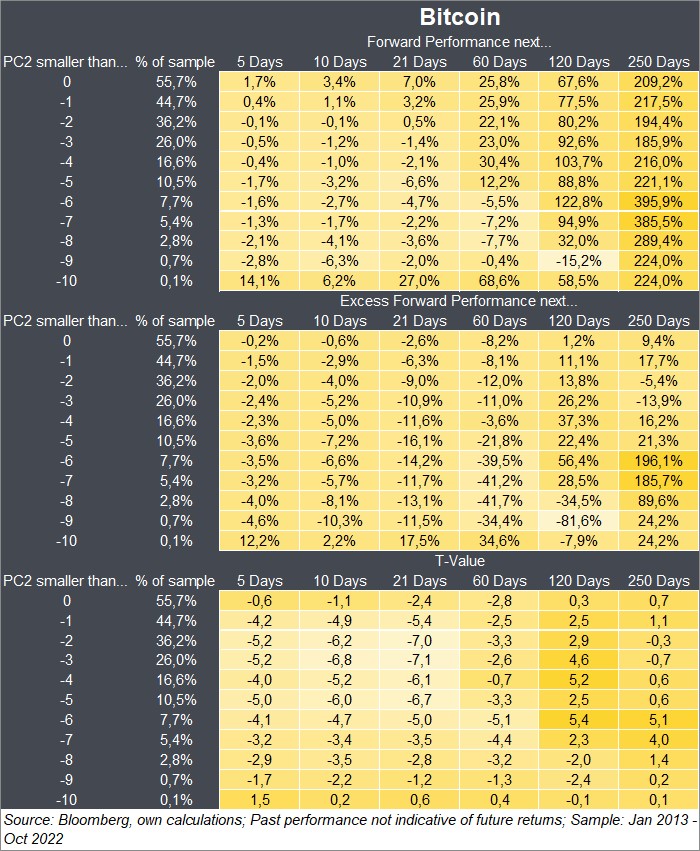
Forward Performances are the subsequent performances observed after each signal of monetary policy expectations (PC2). Excess performances subtract the mean performance from the respective forward performance in order to focus on performance in excess of the average only. Positive excess performance indicates above-average returns in the subsequent days and negative excess performance indicates below-average returns in the subsequent days after the signal.
Since Bitcoin generally increased on average over time independent of our signal, we have to look at excess performances in order to better estimate the effect of our signal. T-Values display the level of statistical significance of the respective excess forward performance (values above/below +2/-2 are statistically significant).
Very low readings of monetary policy expectations (PC2 smaller than -5), were usually followed by negative Bitcoin performances in the short-term (in the next 60 trading days) but positive (excess) performances in the next 120 trading days and beyond. We already observed very low readings in in mid-February 2022 (-9.9) as well as in late September 2022 (-8.5), so a there is an increasing probability of a turn-around in Bitcoin in the coming months.
Since the market already has very high expectations of upcoming Fed rate hikes (at the time of writing: 5 hikes until end-of-2022 and a Terminal Rate of 4.9%) and the fact that the US yield curve is already inverted, there are increasing limits to Quantitative Tightening (“QT”) going forward. The reason is that the US yield curve is empirically one of the best leading indicators to signal a US recession. By this logic, a US recession is more or less “baked in the cake” which is also supported by very weak leading housing data such as the NAHB Home Builder Sentiment or the University of Michigan Home Buying Conditions.
What the ultimate catalyst for a Fed pivot might be, is not foreseeable at this point. However, we think it will most likely be one of the following:
- Tight monetary policy world-wide induces an “accident” and Fed pivots due to financial stability concerns
- Significant decline in US inflation dynamics
- Significant spike in US unemployment
- Any external (geopolitical) catalyst
We don’t think that option 2 and 3 have a high probability in the short term because US inflation dynamics are not going to reach the 2% inflation target within the next 6 months although there is increasing evidence that inflation dynamics are finally rolling over. A significant spike in unemployment may be a bit more likely although forward-looking indicators of unemployment such as initial unemployment claims do not signal an imminent rise in unemployment, either.
However, the risk that tight monetary policy world-wide might induce an “accident” is increasing. The UK fiscal fiasco speaks volumes in this regard. Consider the following events:
Firstly, the Bank of England (BoE) had to temporarily discontinue QT and resume bond buying of Gilt securities in order to stabilize the Gilt market. Yields had increased to such prohibitive levels that were not sustainable for UK government finances in the long term. Thus, the BoE ultimately “pivoted” due to financial stability concerns.
Secondly, the Bank of Canada (BoC) has recently underwhelmed market expectations of a larger rate hike fueling concerns of potential “over-tightening” with respect to the hot Canadian housing market and potential systemic risks stemming from that.
Thirdly, the Bank of Japan (BoJ) has recently intervened in foreign exchange markets multiple times in order to stabilize the Yen-US Dollar exchange rate and keep the yield target of 10-year JGBs at 25 Bps. The Yen has depreciated in a disorderly fashion lately. The effect of these Yen interventions is that the BoJ effectively sells Dollars in exchange for Yen, which increases Dollar liquidity.
Lastly, there have been similar interventions by the People’s Bank of China (PBoC) in order to stabilize the Yuan due to relentless capital outflows from China. This also tends to increase Dollar liquidity globally.
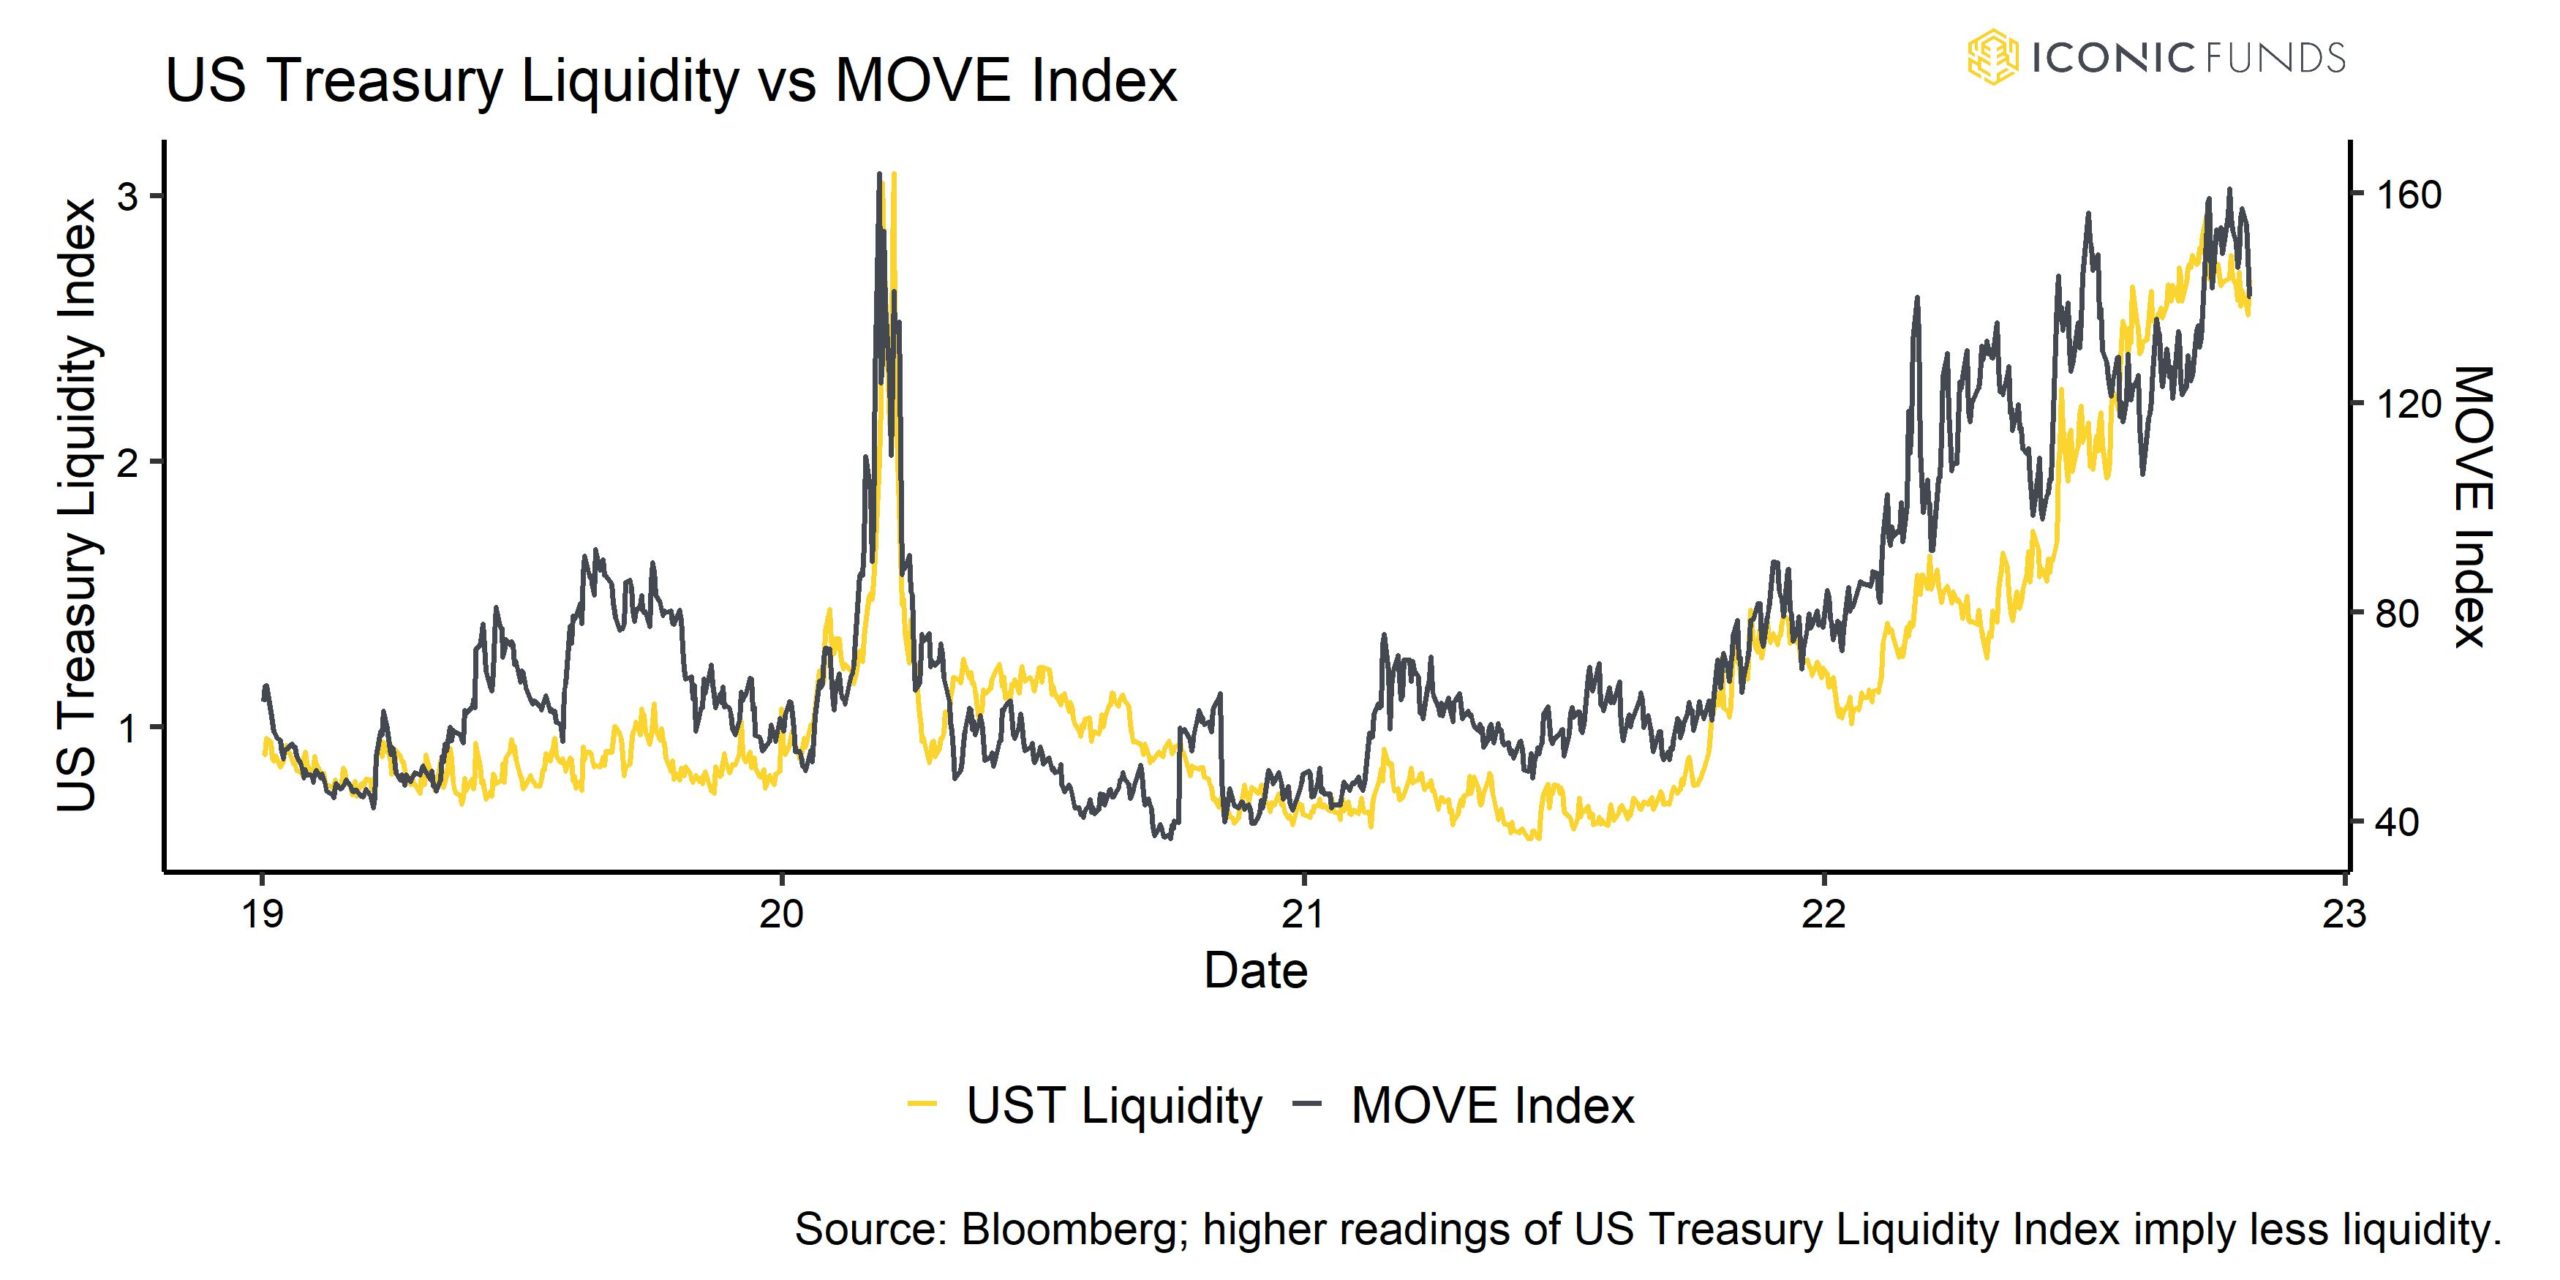
Speaking of Dollar liquidity, the situation in the US is also getting more precarious by the day. The ongoing QT by the Fed has reduced liquidity in the bond market so much that liquidity is as bad as during the Covid-19 shock in April 2020. Tighter liquidity has led to an increase in implied volatilities priced into US Treasury options as measured by the MOVE Index. Thus, tight liquidity is increasing the expected volatility of US Treasuries which is a signal of rising uncertainty among US Treasury traders as well.
Apart from that, systemic stress indicators published by major central banks itself such as the ECB have also increased significantly signaling an increased probability of a systemic risk event that may prompt central banks to halt or even reverse the telegraphed pace of rate hikes.
Bottom Line:
Close to “peak hawkishness” of US monetary policy but risks remain to the downside in the short-term. Fed pivot will likely be induced by an accident or external (geopolitical) event rather than a significant decline in US inflation or spike in US unemployment in the short term.
Based on our analyses, increasing evidence of peak hawkishness is in our view the necessary condition for a sustained macro bottom in Bitcoin and cryptoassets in general.

On-Chain Analytics
A look at Bitcoin on-chain metrics reveals that neither bears nor bulls remain in control at the moment. Market prices are trading below cost-basis which lies around ~21k USD. So, on average investors are still feeling pain in terms of unrealized losses and the majority of investors are still under water. Nonetheless, although unrealized losses remain at very high levels, the spent output-profit ratio (SOPR) reveals that selling pressure has been slowly receding in the last month.
At the same time, the % supply of coins that has been last active in over a year has increased further to more than 66%, indicating that investors are sitting still to ride out this bear phase. The conviction among long-term investors remains unshattered by the bear market as can be seen by the wealth held by coins older than 3-months that is now at an all-time high. High readings have historically been achieved around bear market bottoms as they signal that “strong hands”/long-term investors have already accumulated a majority of coins and “weak hands”/short-term investors have mostly exited the market.
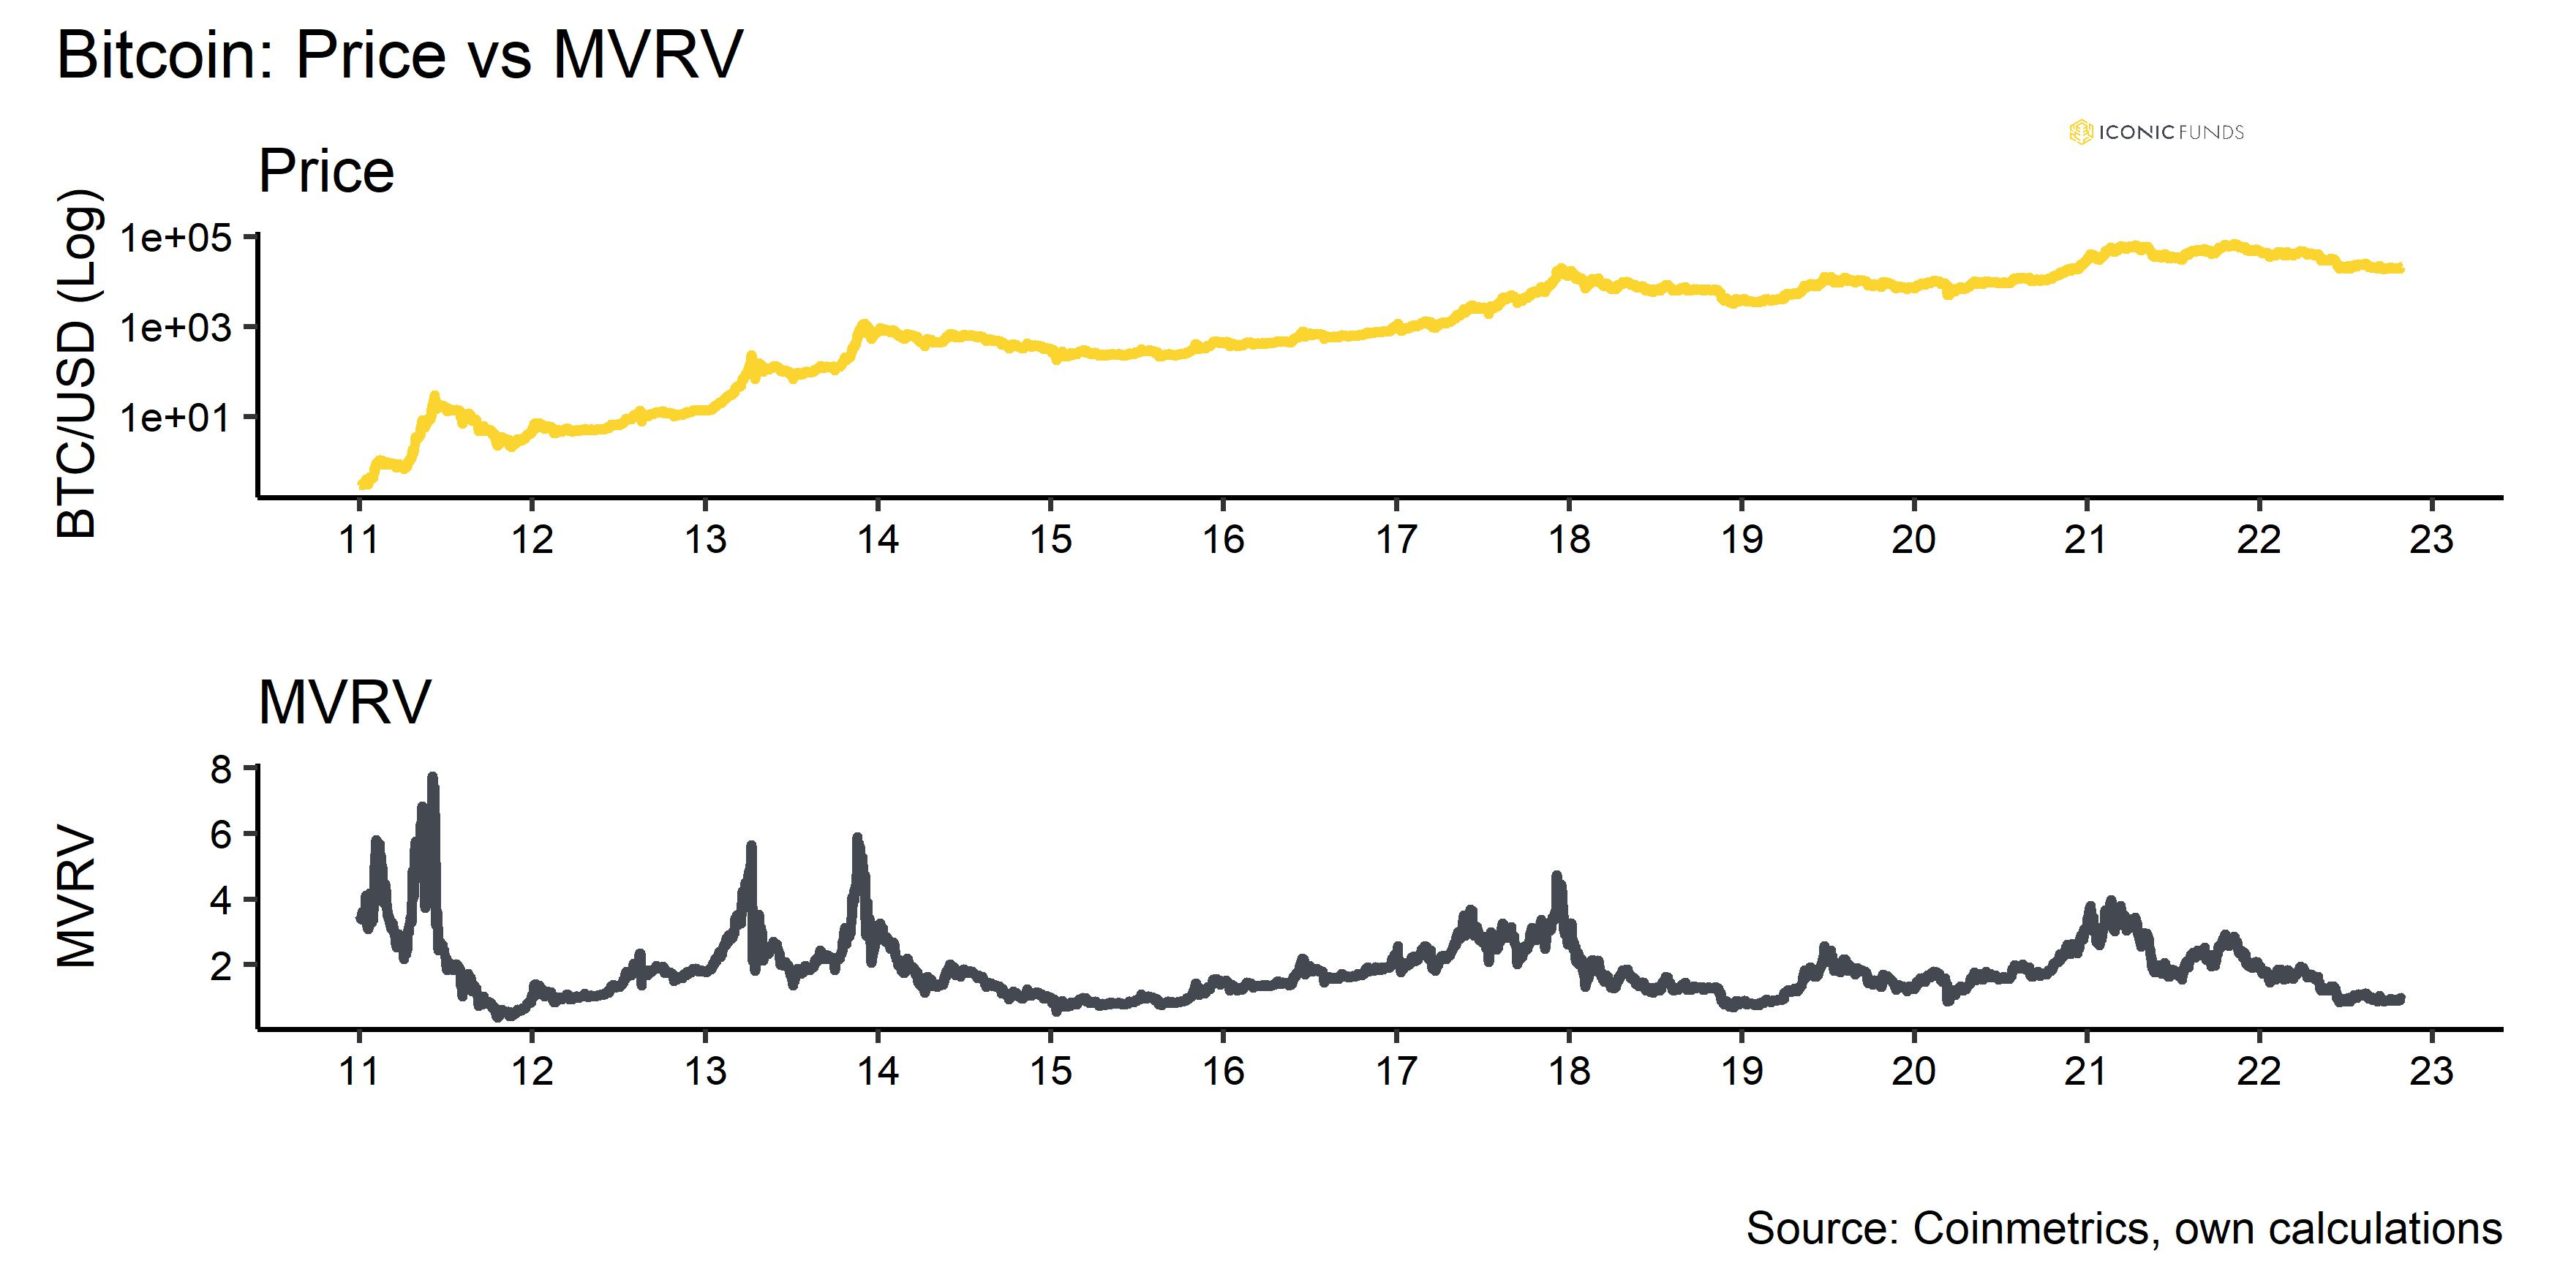
One reason for this might be that, based on a variety of valuation metrics, Bitcoin remains relatively cheap. Our own composite measure of Bitcoin valuation is currently standing at the 29% percentile which is relatively cheap in historical comparison. The composite valuation metric consists of 7 different valuation metrics such as the Market Value-to-Realized Value (MVRV) or the Mayer Multiple.
A main talking point among on-chain analysts are Bitcoin miners: The very low “Puell Multiple”, which measures the amount of daily miner revenue relative to its 1-year moving average, implies a very harsh operating environment which poses some downside risks in case of miner balance distribution.
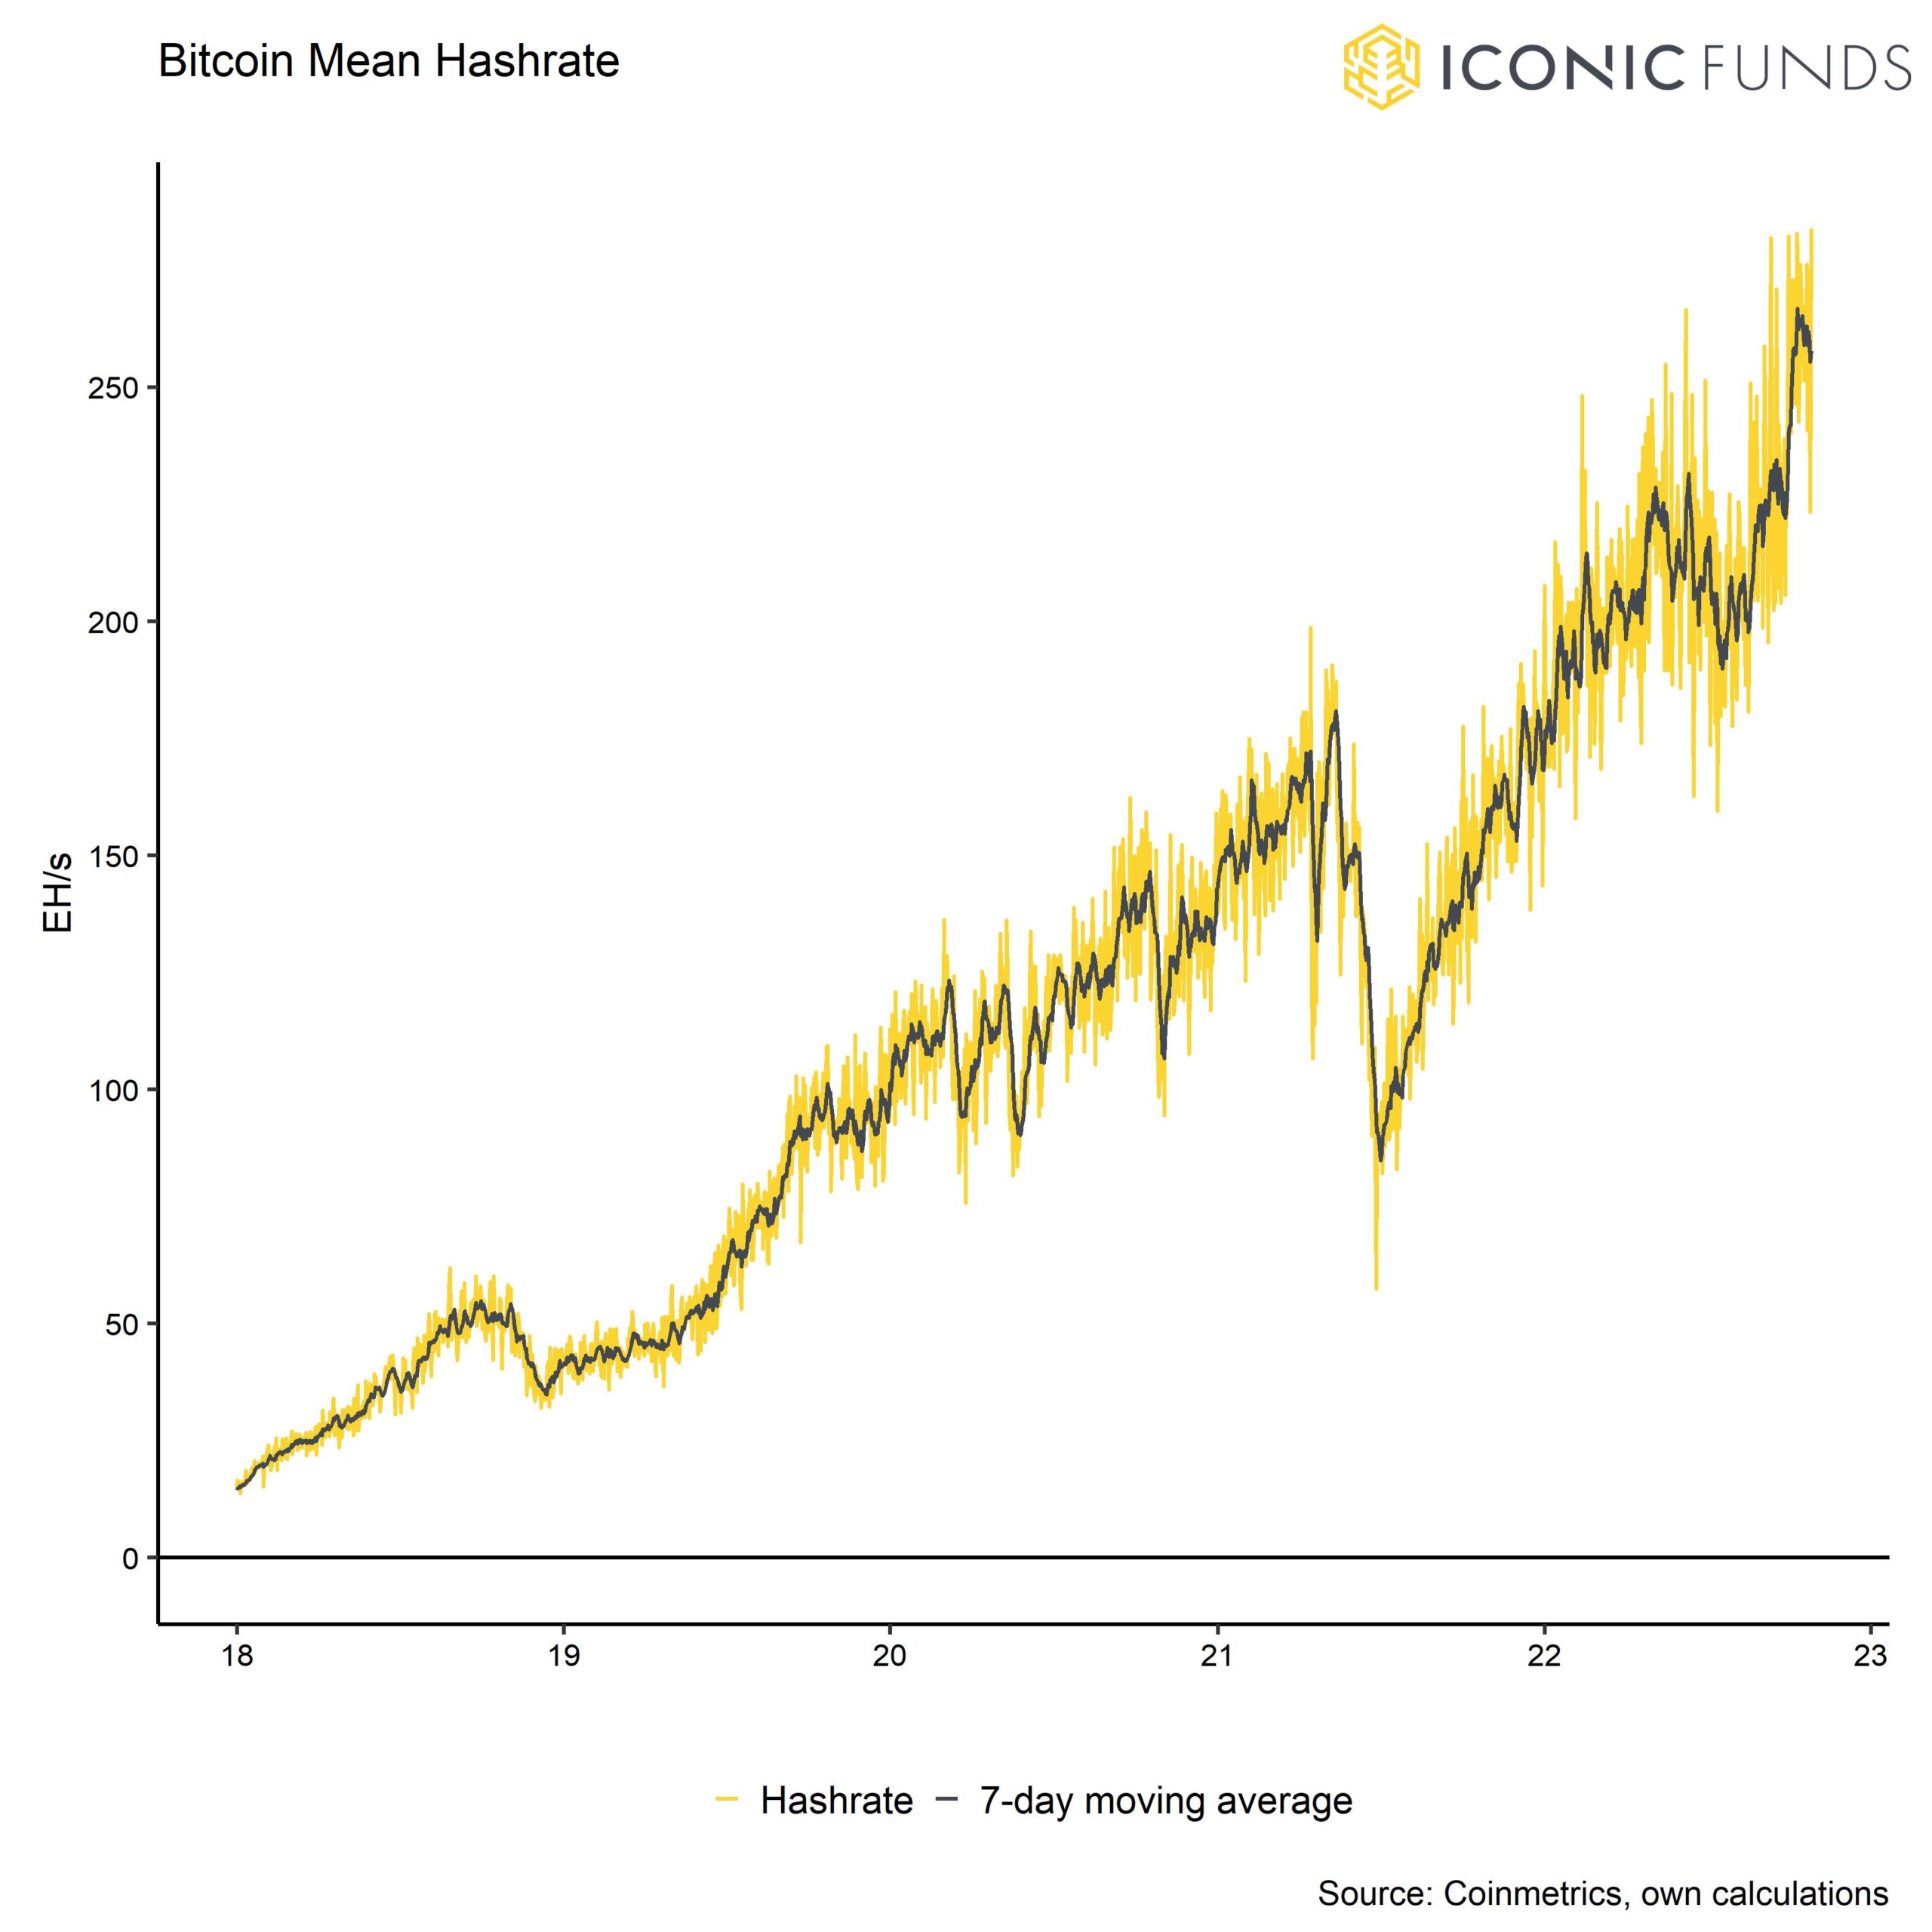
In aggregate, Bitcoin miners have recently managed to increase their hash rate to a new all-time high. The new hash rate coming online now is probably due to the long lags between financing of new mining equipment and installation of these rigs which usually takes around a year for institutional miners but is also due to the fact that hash rate migrated from Ethereum PoW to other PoW tokens including Bitcoin after the Ethereum Merge. The increase in hash rate exacerbates the revenue side as it potentially decreases the relative hash rate contribution and therefore potential volume of mined coins.
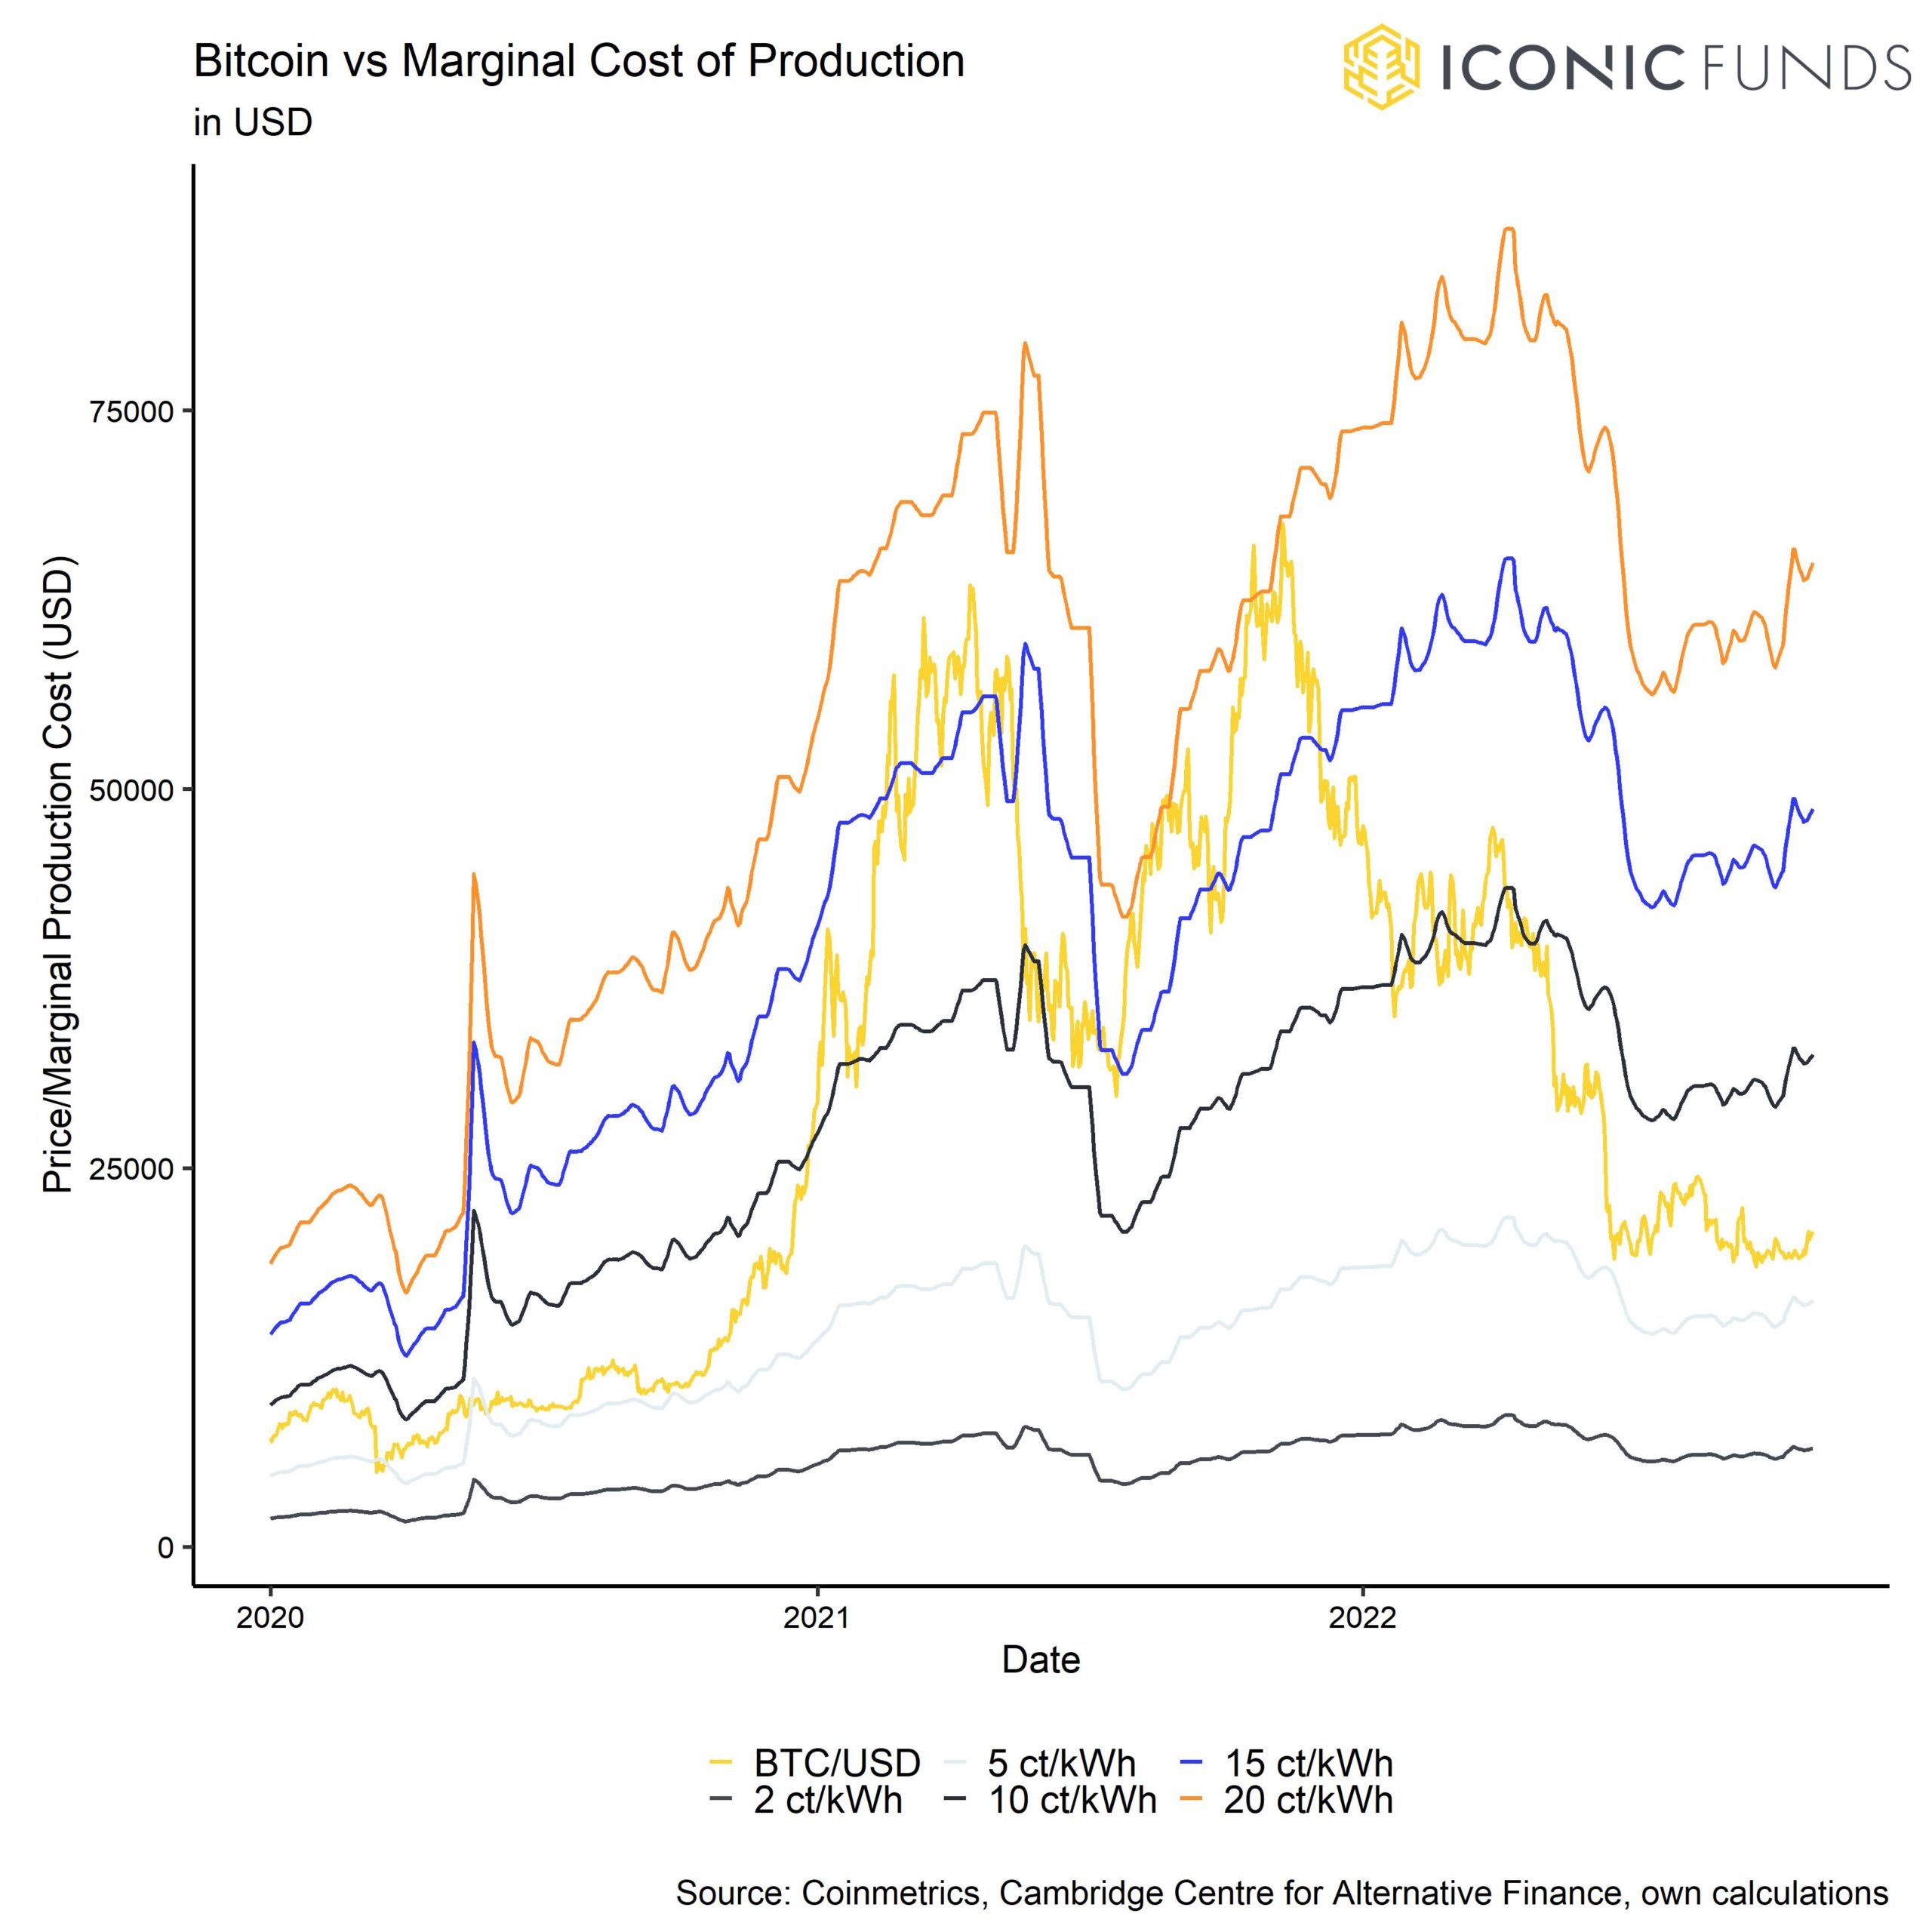
However, according to our own estimations, the current price of around ~20k USD is already putting significant pressure on competitive Bitcoin miners with marginal production costs of around ~10 USD Cents per kWh.
The problem now is rather that major institutional miners have generally high leverage ratios and increased financing costs may put pressure on their cash flow position. One of the largest institutional miners Core Scientific (CORZ), has already lost 98% of its stock price this year which is emblematic for the pressure on the whole industry. The market has started to price in a potential default of Core Scientific, increasing the risk of miner balance liquidations.
Overall, miner wallet Bitcoin transfers to exchanges remain low although we had some increased transfers in mid-October that were the highest since June 2022. Miner wallet transfers to exchanges usually imply selling intention by miners and are therefore considered to be a bearish signal. Miners have been gradually reducing their Bitcoin balances since end of July 2022 shortly after the Luna Crash by around 14k BTC in total with only minor price effects so far.
At the same time, the continuous decline in exchange balances implies that larger institutional investors continue to accumulate coins on a net basis. We have recently seen some very significant exchange outflows from major exchanges such as Coinbase that imply ongoing institutional-grade investments into Bitcoin. In general, there has been significant accumulation activity in very large wallets that hold 100k BTC or more as well as smaller wallet cohorts (see Accumulation Score in appendix).
Bottom Line:
Overall selling pressure has receded, and long-term investors are still accumulating strongly as valuations are relatively cheap. Potential miner capitulation may pose a near-term risk due to increasing revenue pressure.
Download the full report with appendix here.
About Iconic Funds
Iconic Funds is the bridge to crypto asset investing through trusted investment vehicles. We provide investors both passive and alpha-seeking strategies to crypto, as well as venture capital opportunities.
We deliver excellence through familiar, regulated vehicles offering investors the quality assurances they deserve from a world-class asset manager as we champion our mission of driving crypto asset adoption.
Recent News and Articles
- Institutional Crypto Adoption: Why & How Institutions Are Going Crypto
- Crypto Portfolio Composition: How Different Portfolios Have Performed During the Recent Bull and Bear Markets
- Tailor-Made Crypto Funds: How the Iconic Quant Solutions Team Enables Investors to Earn Target Returns
- How to Invest in Ethereum (ETH): A Guide for Professional Investors
- The Case for Actively Managed Investment Strategies in the Crypto Markets
- How to Invest in NFTs: A Guide for Professional Investors
- Why Bitcoin’s Volatility Shouldn’t Scare You
- How accurate is the Bitcoin Stock-to_Flow Model?
Iconic in Press
- ETF stream: White-label issuers in Europe quietly tripled in a week
- ETF strategy: Iconic Funds debuts world’s first ApeCoin crypto ETP
- Das Investment: Kryptowährungen kommen 2022 im Mainstream an
- Private Banking Magazin, Bitcoin – das perfekte Beispiel für ein ESG-Investment?
- Institutional Money, Krypto-Manager steigt bei Family Office ein
- Morningstar, Iconic Funds Expands Product Range With a Physical Ethereum ETP
Recent Research Reports
Cryptoassets and the Macroeconomy: Can macro factors explain the price of Bitcoin?
Analyzing the Primary Value Drivers of Leading Cryptocurrencies ➡ Download here
How Effective are Common Investment Strategies with Bitcoin? ➡ Download here
For further information, please visit deutschedastg
Legal Disclaimer
The material and information contained in this article is for informational purposes only. Iconic Holding GmbH, its affiliates, and subsidiaries are not soliciting any action based upon such material. This article is neither investment advice nor a recommendation or solicitation to buy any securities. Performance is unpredictable. Past performance is hence not an indication of any future performance. You agree to do your own research and due diligence before making any investment decision with respect to securities or investment opportunities discussed herein. Our articles and reports include forward-looking statements, estimates, projections, and opinions. These may prove to be substantially inaccurate and are inherently subject to significant risks and uncertainties beyond Iconic Holding GmbH’s control. We believe all information contained herein is accurate, reliable and has been obtained from public sources. However, such information is presented “as is” without warranty of any kind.