
Crypto Market Intelligence May 2023
by André Dragosch, Head of Research
Key Takeaways
- Cryptoassets posted a negative performance in May due to the congestion of the Bitcoin network which is gradually easing off
- Concerning the debt ceiling debate, both increasing fiscal debts and negative real interest rates are likely going to be a tailwind for cryptoassets
- Despite some gloominess in the market right now, some large institutional buyers appear to support prices at these levels which is evident in the high degree of accumulation activity at the moment
Chart of the month
Cryptoasset Performance
Cryptoassets posted a negative performance in May mainly due to the congestion of the Bitcoin network that had increased risk aversion among users and investors. Since the issue was more specific to Bitcoin, Ethereum managed to outperform by almost +700 bps in May.
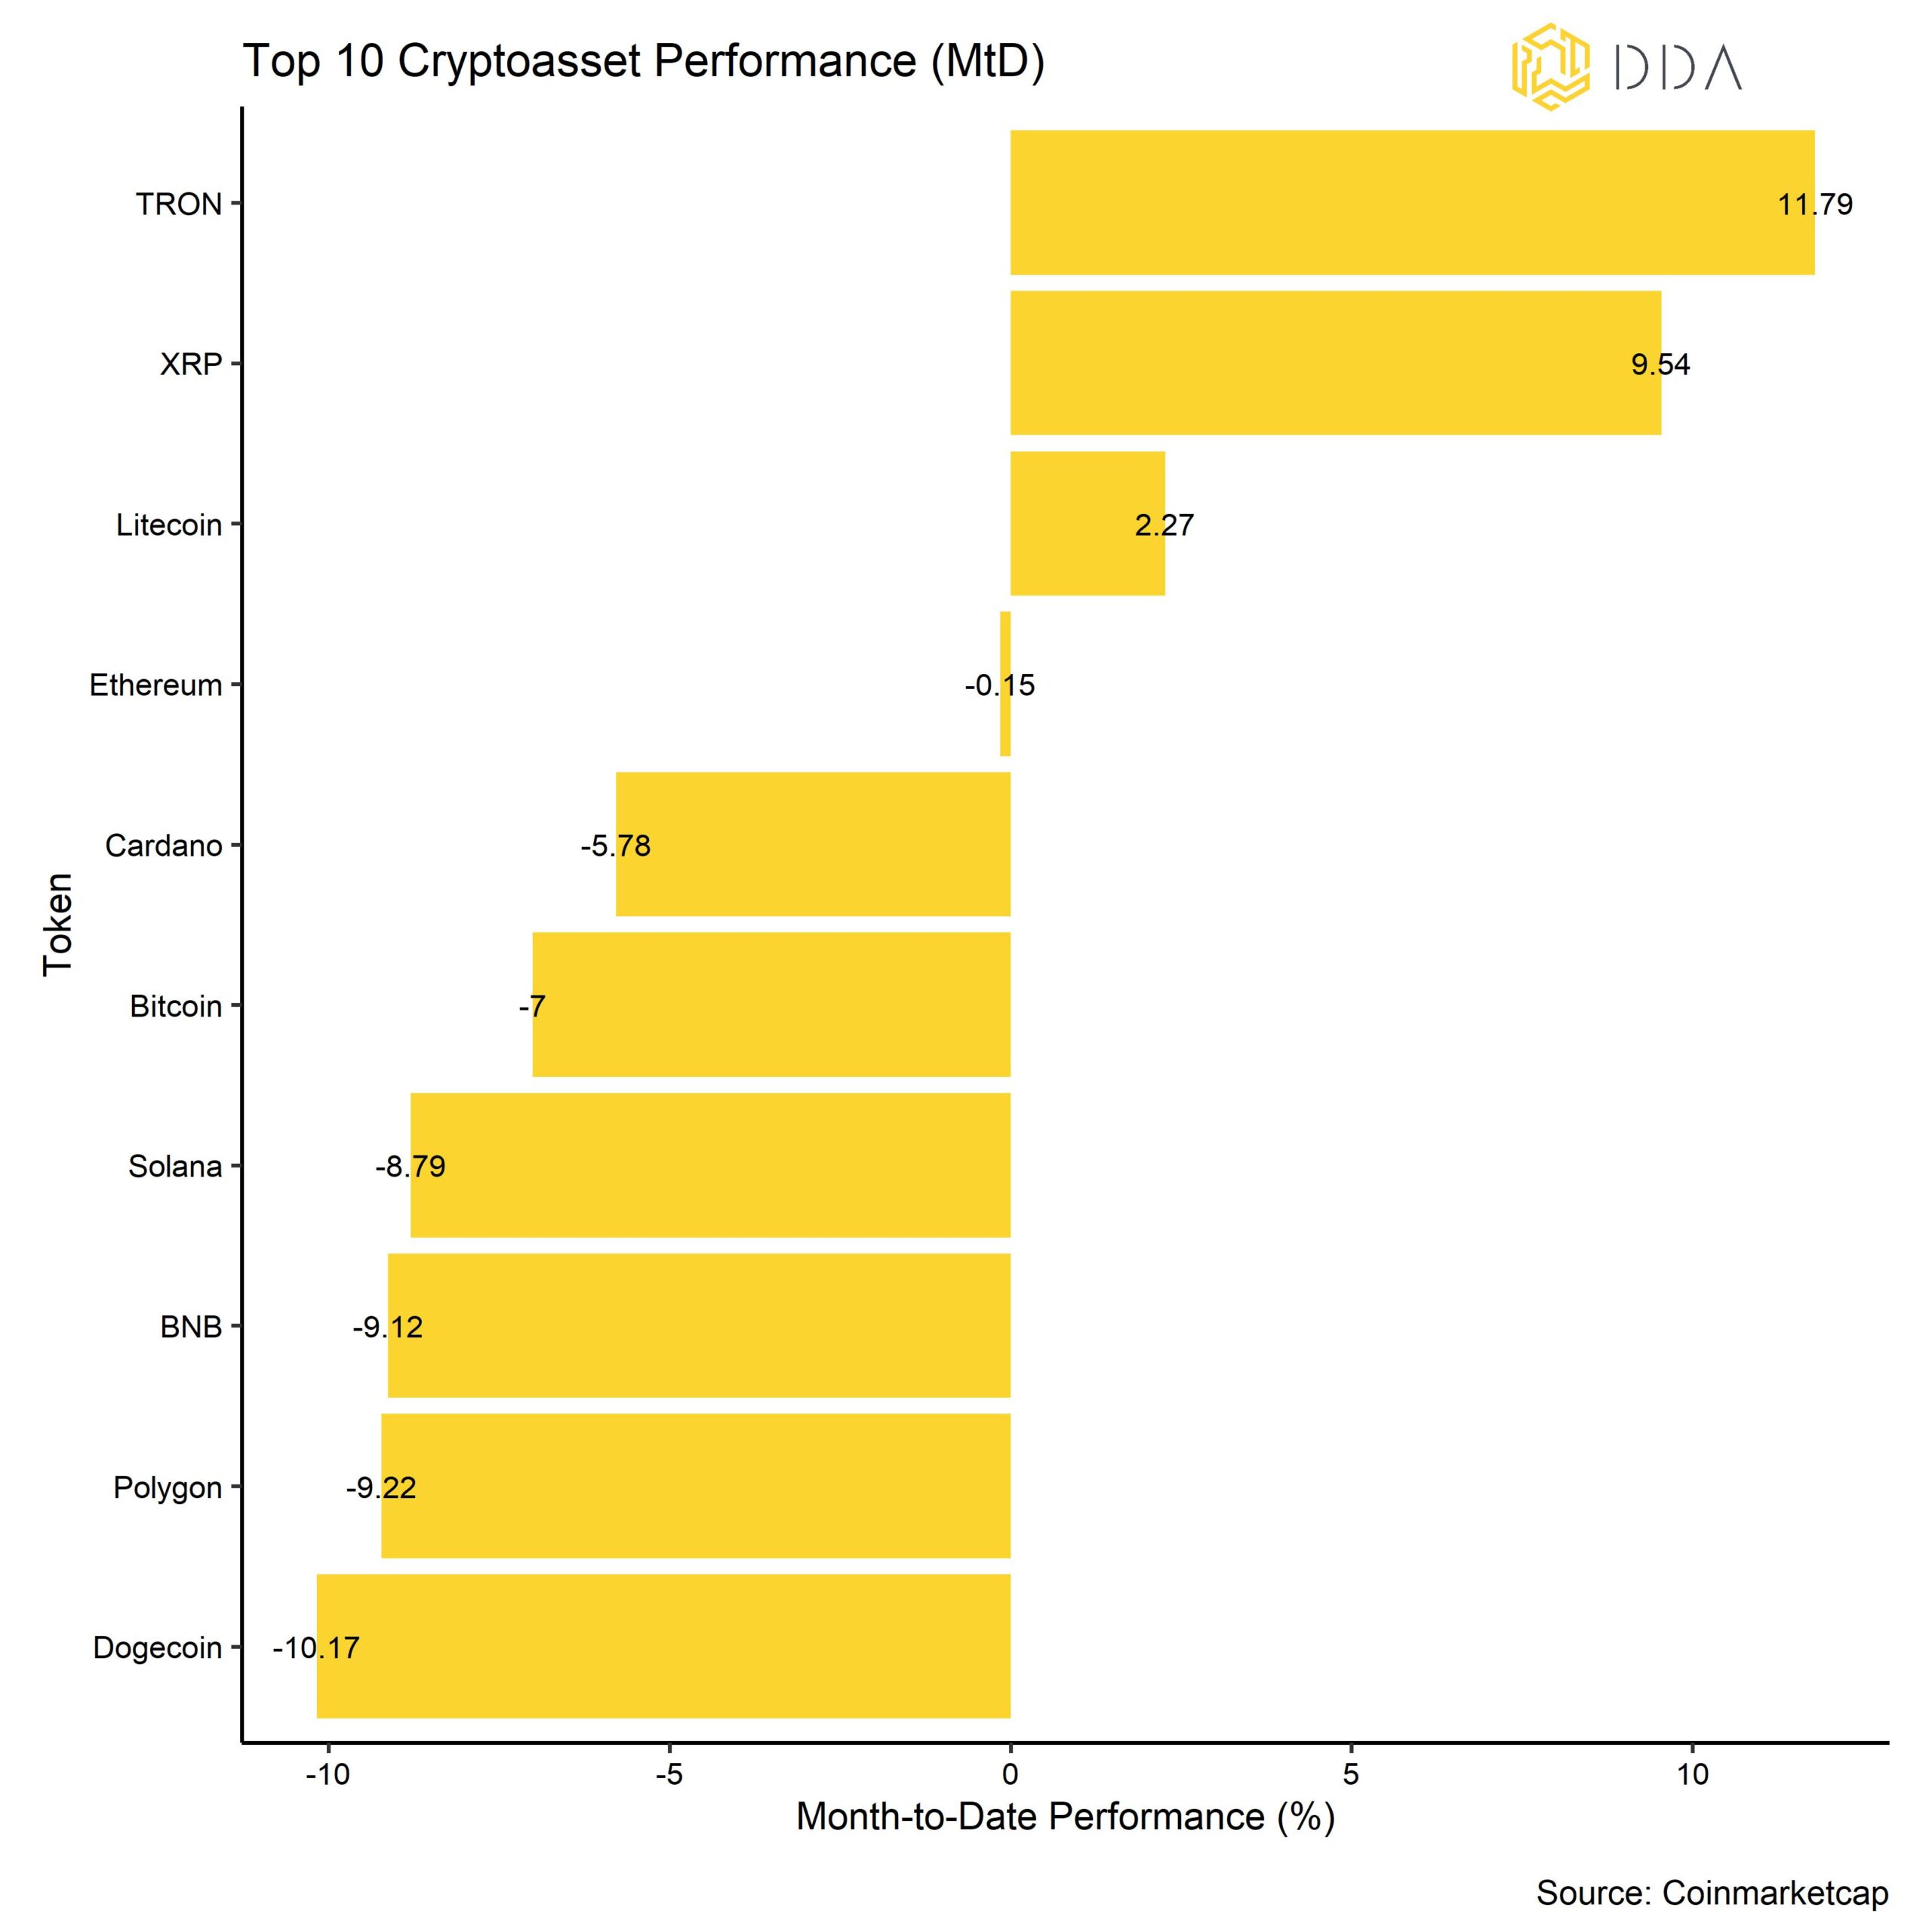
Performance dispersion among cryptoassets continued to pick up significantly during the last month. An increase in dispersion means that cryptoasset performances are increasingly driven by coin-specific factors in contrast to systematic factors. This was also accompanied by an increase in altcoin outperformance vis-à-vis Bitcoin. In the month of May, 30% of our tracked altcoins managed to outperform Bitcoin.
In general, among the top 10 major cryptoassets, TRON, XRP, and Litecoin have been the main outperformers. TRON was buoyed by the prospect that Hong Kong retail investors will be allowed to trade on its affiliated exchange Huobi. XRP was supported by positive expectations for the outcome of the ongoing trial against the SEC. Litecoin was mainly supported by a surge in network activity that appears to be related to the upcoming halving in early August.
Likewise, our own DDA products have performed accordingly in May:
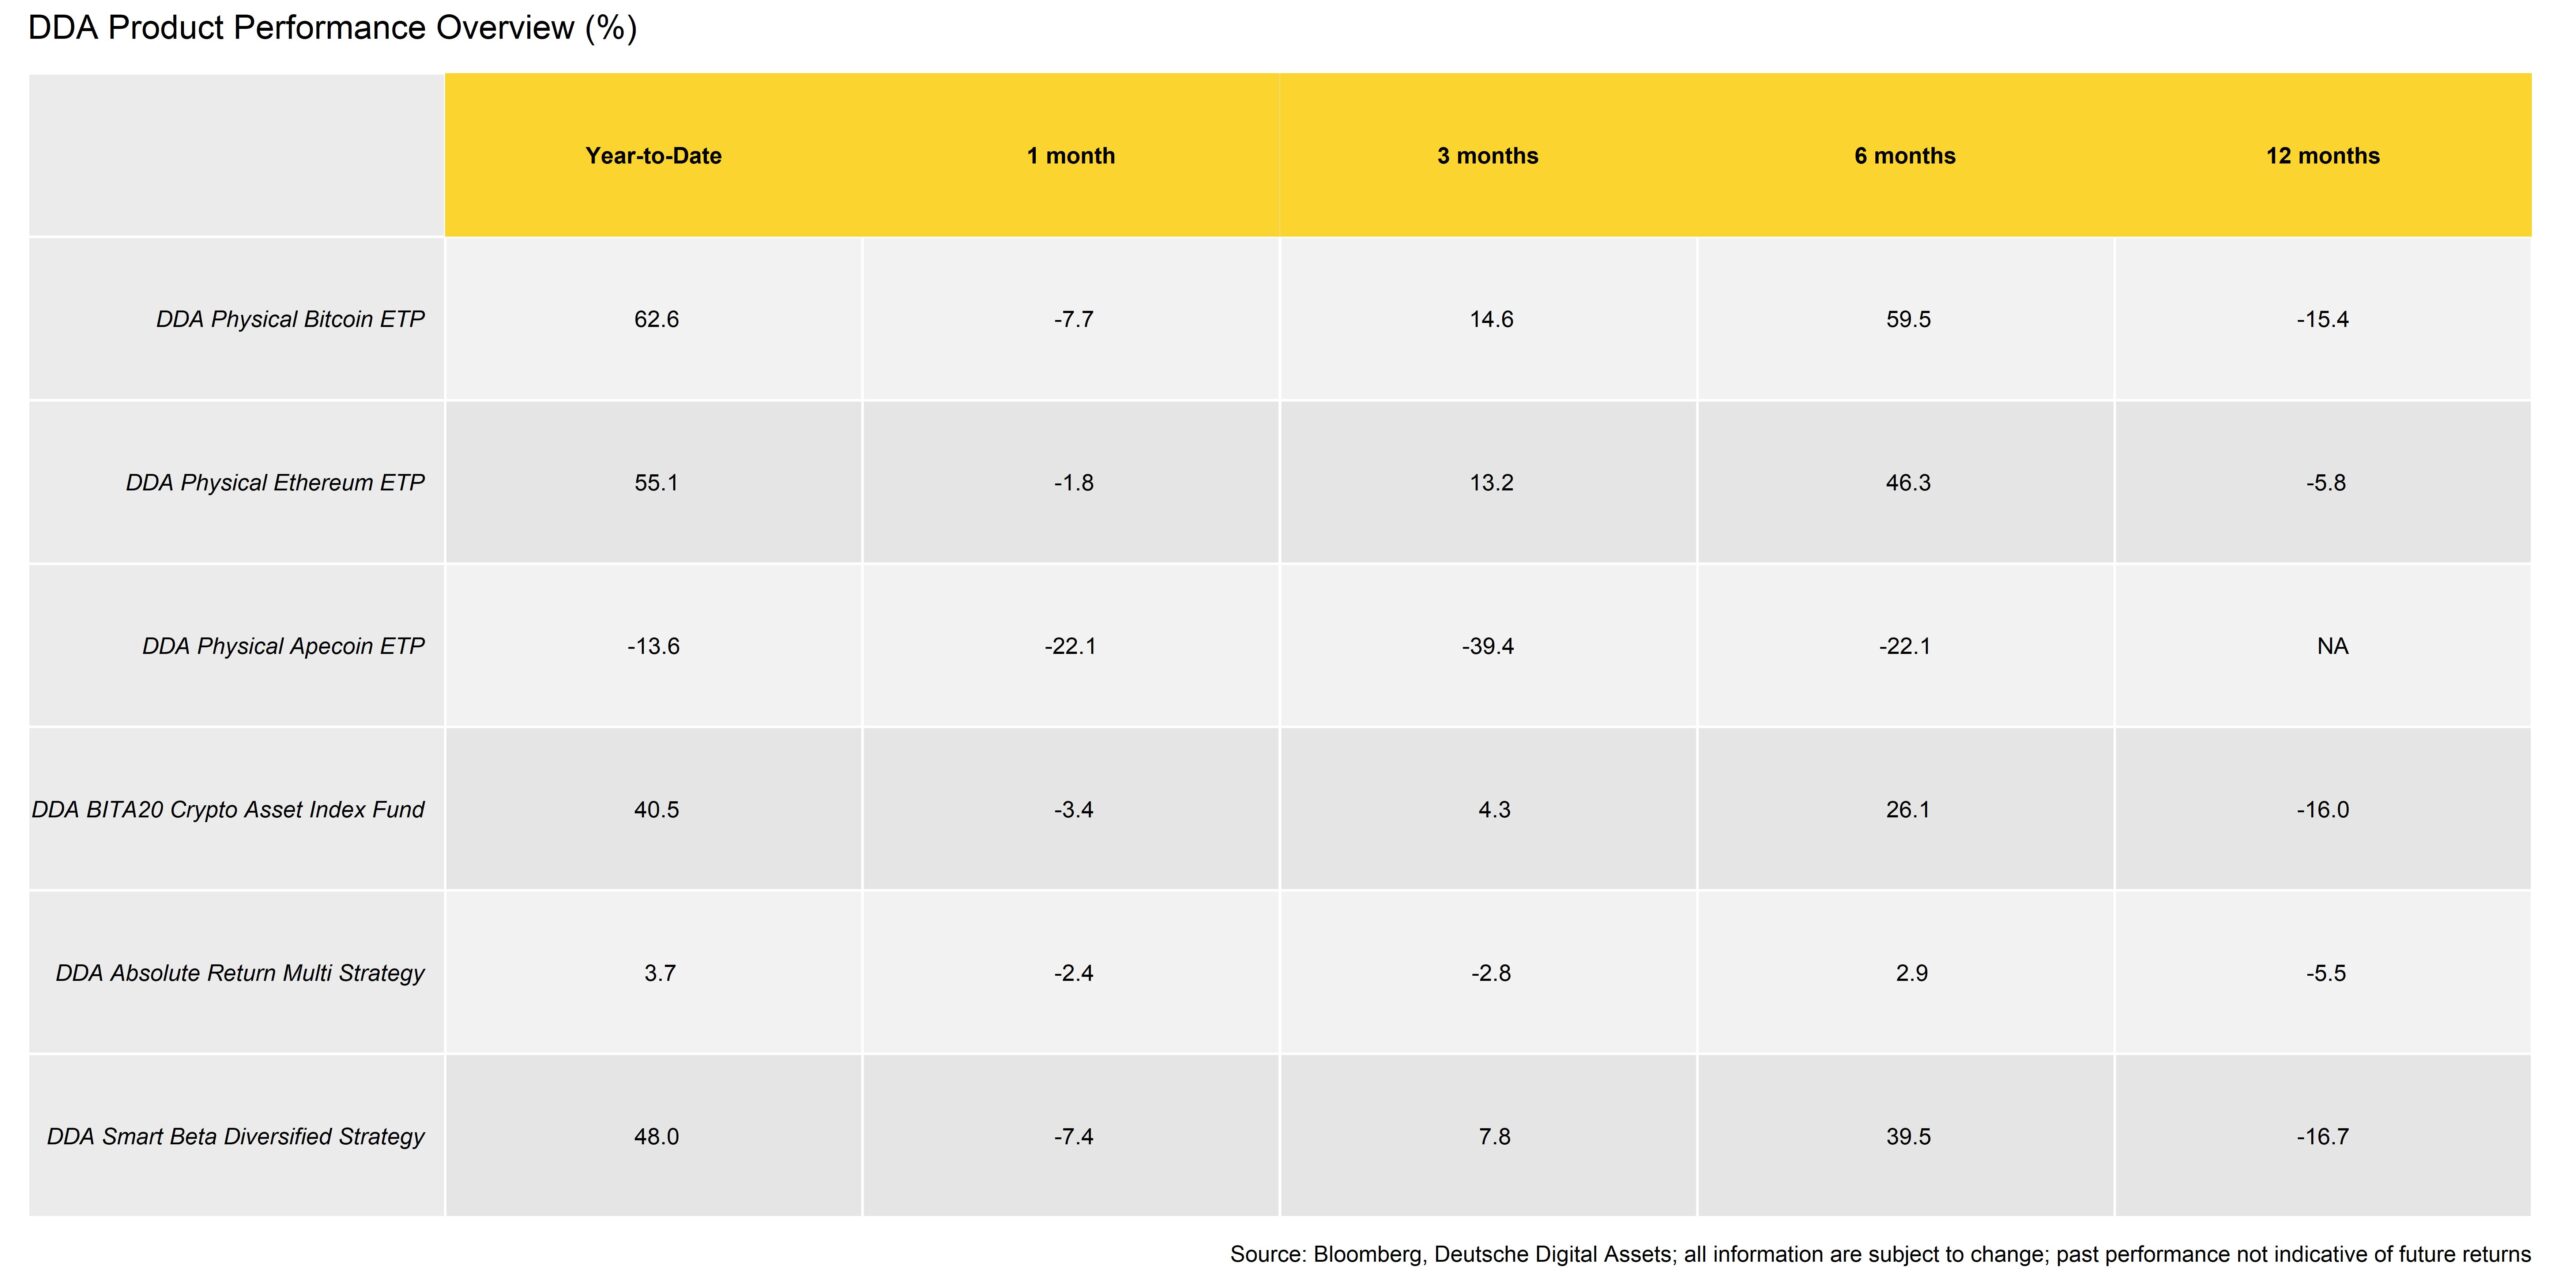
Furthermore, the markets were erratic in May, with no real trend and a marked compression in volatility. This was a complicated environment for our active strategies, which suffered slightly.
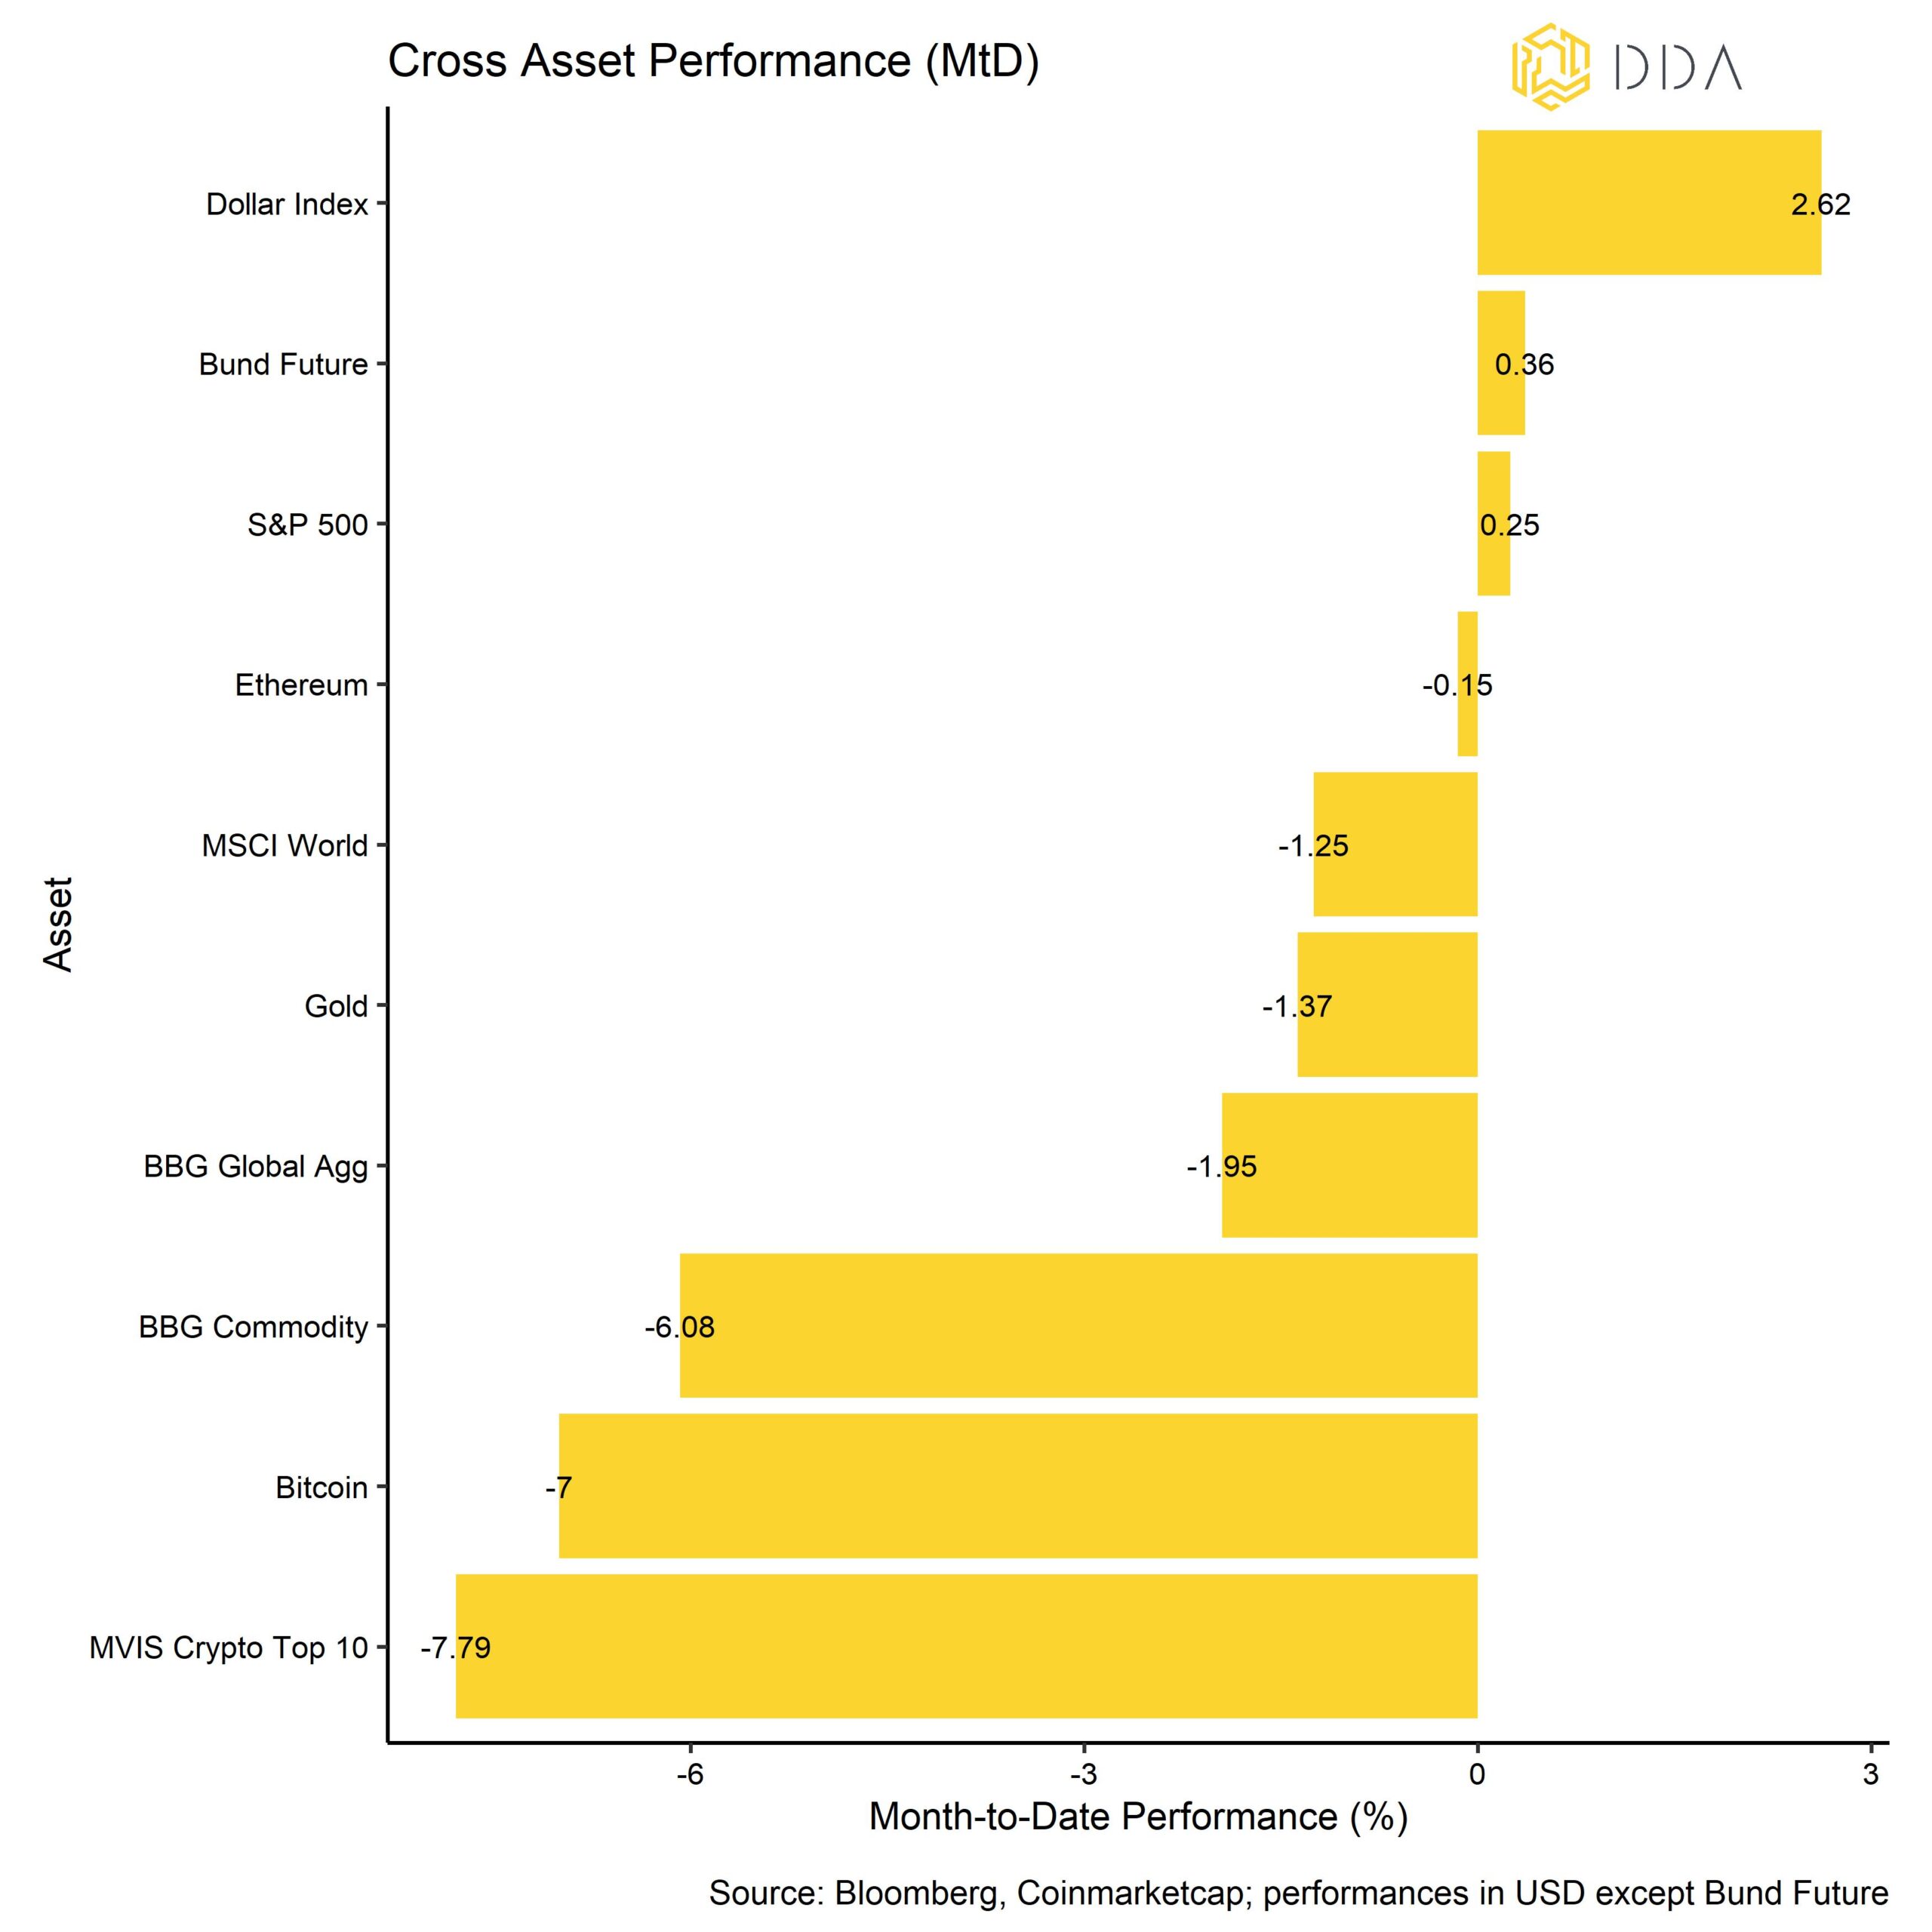
Traditional financial assets mostly went sideways during May. German Bunds outperformed the S&P 500 while the Dollar advanced. Risky assets were mostly held down by the fact that the Fed delivered another rate hike at the beginning of May and continued to deliver a rather hawkish forward guidance.
However, there were significant divergences beneath the surface in the stock market as some mega-cap stocks such as Nvidia managed to rally to multi-year highs on the back of the recent AI euphoria. At the same time, overall market breadth in the US stock market remains very thin.
Bottom Line: Cryptoassets posted a negative performance in May mainly due to the congestion of the Bitcoin network that had increased risk aversion among users and investors. Ethereum significantly outperformed Bitcoin while general altcoin outperformance has started to pick up from lower levels.
Macro & Markets Commentary
The debt ceiling relief seems to have served as a positive catalyst for now. Last week, US lawmakers agreed on extending the debt limit by approximately 4 trn USD to ~35.4 trn USD until approximately January 2025 und submitted to (only) about 50 bn USD in spending cuts.
The US government currently pays 76 bn USD per month (912 bn USD per annum) on interest expenses alone. That is more than the annual expenses on social security and the military. So, interest expenses are already the biggest financial item in the US government’s expenditures.
At the same time, the US federal government is running an annual budget deficit to the tune of -1.94 trn USD per annum.
So, it is essentially a mathematical certainty that total debt will continue to increase in the future.
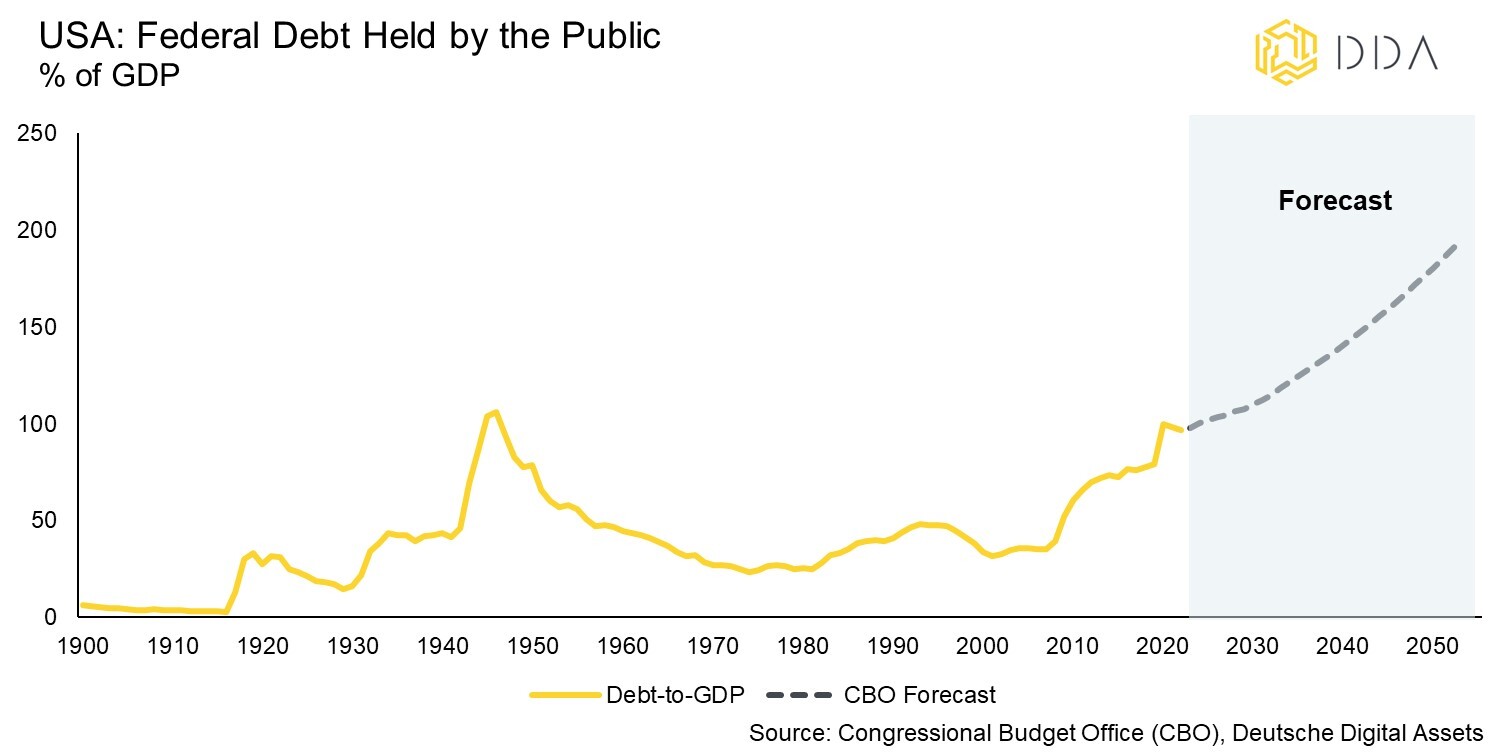
In fact, according to their latest estimates, the Congressional Budget Office (CBO) expects Federal Debt held by the public (which excludes intergovernmental liabilities) to reach 118% of GDP in 2033 and 195% in 2053, up from 97% of GDP at the end of 2022:
Another recession in the US is most-likely going to accelerate this increase in Debt-to-GDP levels as recessions are usually a double-whammy for this ratio due to rising government expenditures for stimuli and social security, and falling government revenues via taxes.
Consider the following formula:
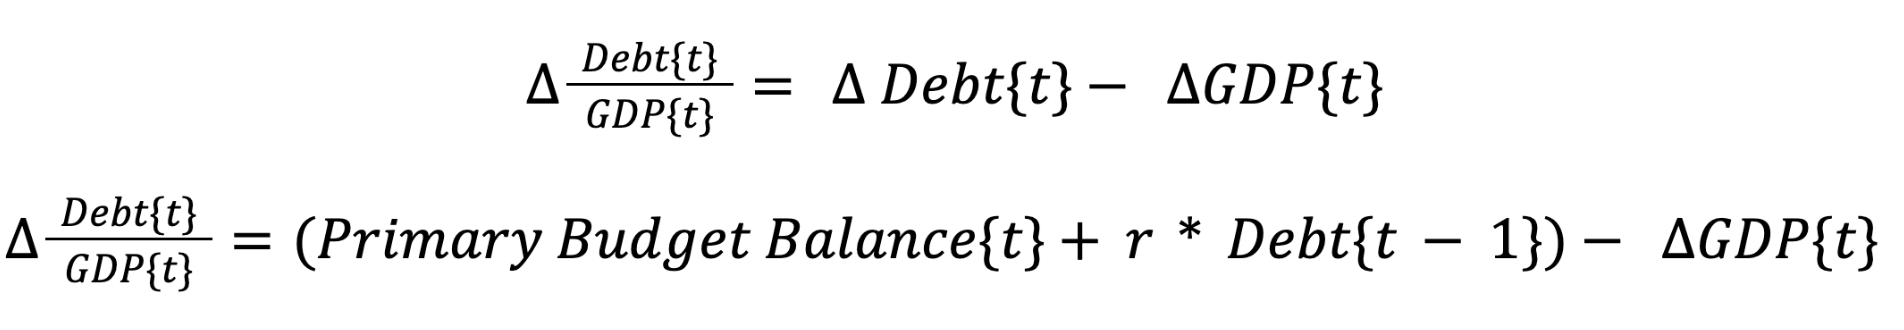
One of the most important metrics with respect to fiscal sustainability is the Debt-to-GDP ratio. Some researchers state that Debt-to-GDP ratios above 60% already have historically increased the probability of sovereign default significantly.
The change in the Debt-to-GDP ratio can be broken down into the change in the primary budget balance plus average interest paid (r) on the stock of debt minus GDP growth. In other words, for the Debt-to-GDP ratio to stay constant, GDP needs to outgrow interest expenses on old debts and any additional debt due to primary budget deficits.
However, the latest figures imply that US government debt to GDP has been decreasing, a process which seems to have accelerated post-Covid. The reason is that nominal GDP has been increasing faster than nominal debt outstanding, especially during the strong post-Covid economic recovery.
This recovery in nominal GDP was mainly due to the increase in the GDP deflator (ie inflation) and less in real GDP growth since 2022. So, there is a case to be made that the US government might already be in the process of “inflating away” the debt and engaging what is commonly known as “financial repression”.
This was most-certainly true in the aftermath of March 2020 until May 2022 when real interest rates on US 10-year TIPS were deeply negative. So, anticipated inflation over the next 10-years was higher than the nominal interest rate paid.
However, at the time of writing, inflation expectations over the next 10-years based on US CPI Swaps is around 2.52% p.a. while the yield on US 10-year Treasuries is currently 3.73% p.a. Thus, Treasury investors are still expected to be compensated for their loss in purchasing power over the next 10 years.
This may change again, when the Fed starts another easing cycle in monetary policy which is bound to lead to declining nominal interest rates and simultaneously increasing inflation expectations – a process which should decrease real interest rates.
This should ultimately provide a tailwind for risky assets and in particular cryptoassets via an easing in financial conditions which most-likely entails a weakening US Dollar.
Amid high levels of US government debt, this also appears to be the likeliest scenario.
In any case, both increasing fiscal debts and negative real interest rates are likely going to be a tailwind for cryptoassets.
On the one hand, increasing fiscal debts increase the likelihood of sovereign default and by association the occurrence of a systemic banking crisis. The recent SVB saga has shown that this is net positive for cryptoassets, in particular Bitcoin.
On the other hand, if the US government and the Fed continue to engage in financial repression via negative real interest rates in the coming years, this will result in rising inflation expectations due to easing financial conditions.
However, in the very short term, the debt ceiling resolution may prove to be a headwind for cryptoassets. The reason is that a refill of the so-called Treasury General Account (TGA) at the Fed due to increase Treasury bond issuances will draw down overall banking system liquidity. Although the net effect of the TGA refill is not entirely straight-forward as some funds invested in reserve repos might just switch to T-Bills, it is generally expected that this will be net negative for overall liquidity which could weigh on cryptoasset prices in the short term. Cryptoasset prices have shown a high correlation to changes in banking system liquidity this year.
Another major talking point among investors was the fact that the recent AI craze has provided a strong tailwind to mega-cap stocks in the US, especially semiconductor companies like Nvidia which could be a strong beneficiary of AI due to its business exposure to data centers.
The issue from a macro point of view is that these tailwinds to growth and corporate profits are rather medium-term in nature. However, AI beneficiary stocks like Nvidia were the main supporters of this year’s rallye in the US stock market. Over-optimistic expectations might not fully materialize which could create some downside pressure again.
So, there are already very high expectations priced into the market and attention on the subject of Artificial Intelligence/AI is extraordinarily high judging by the very high amount of Google search queries for “artificial intelligence”. The level of search queries for “artificial intelligence” is already comparable to past cycle peaks in “bitcoin” (2014, 2017, 2021) and “metaverse” (2022).
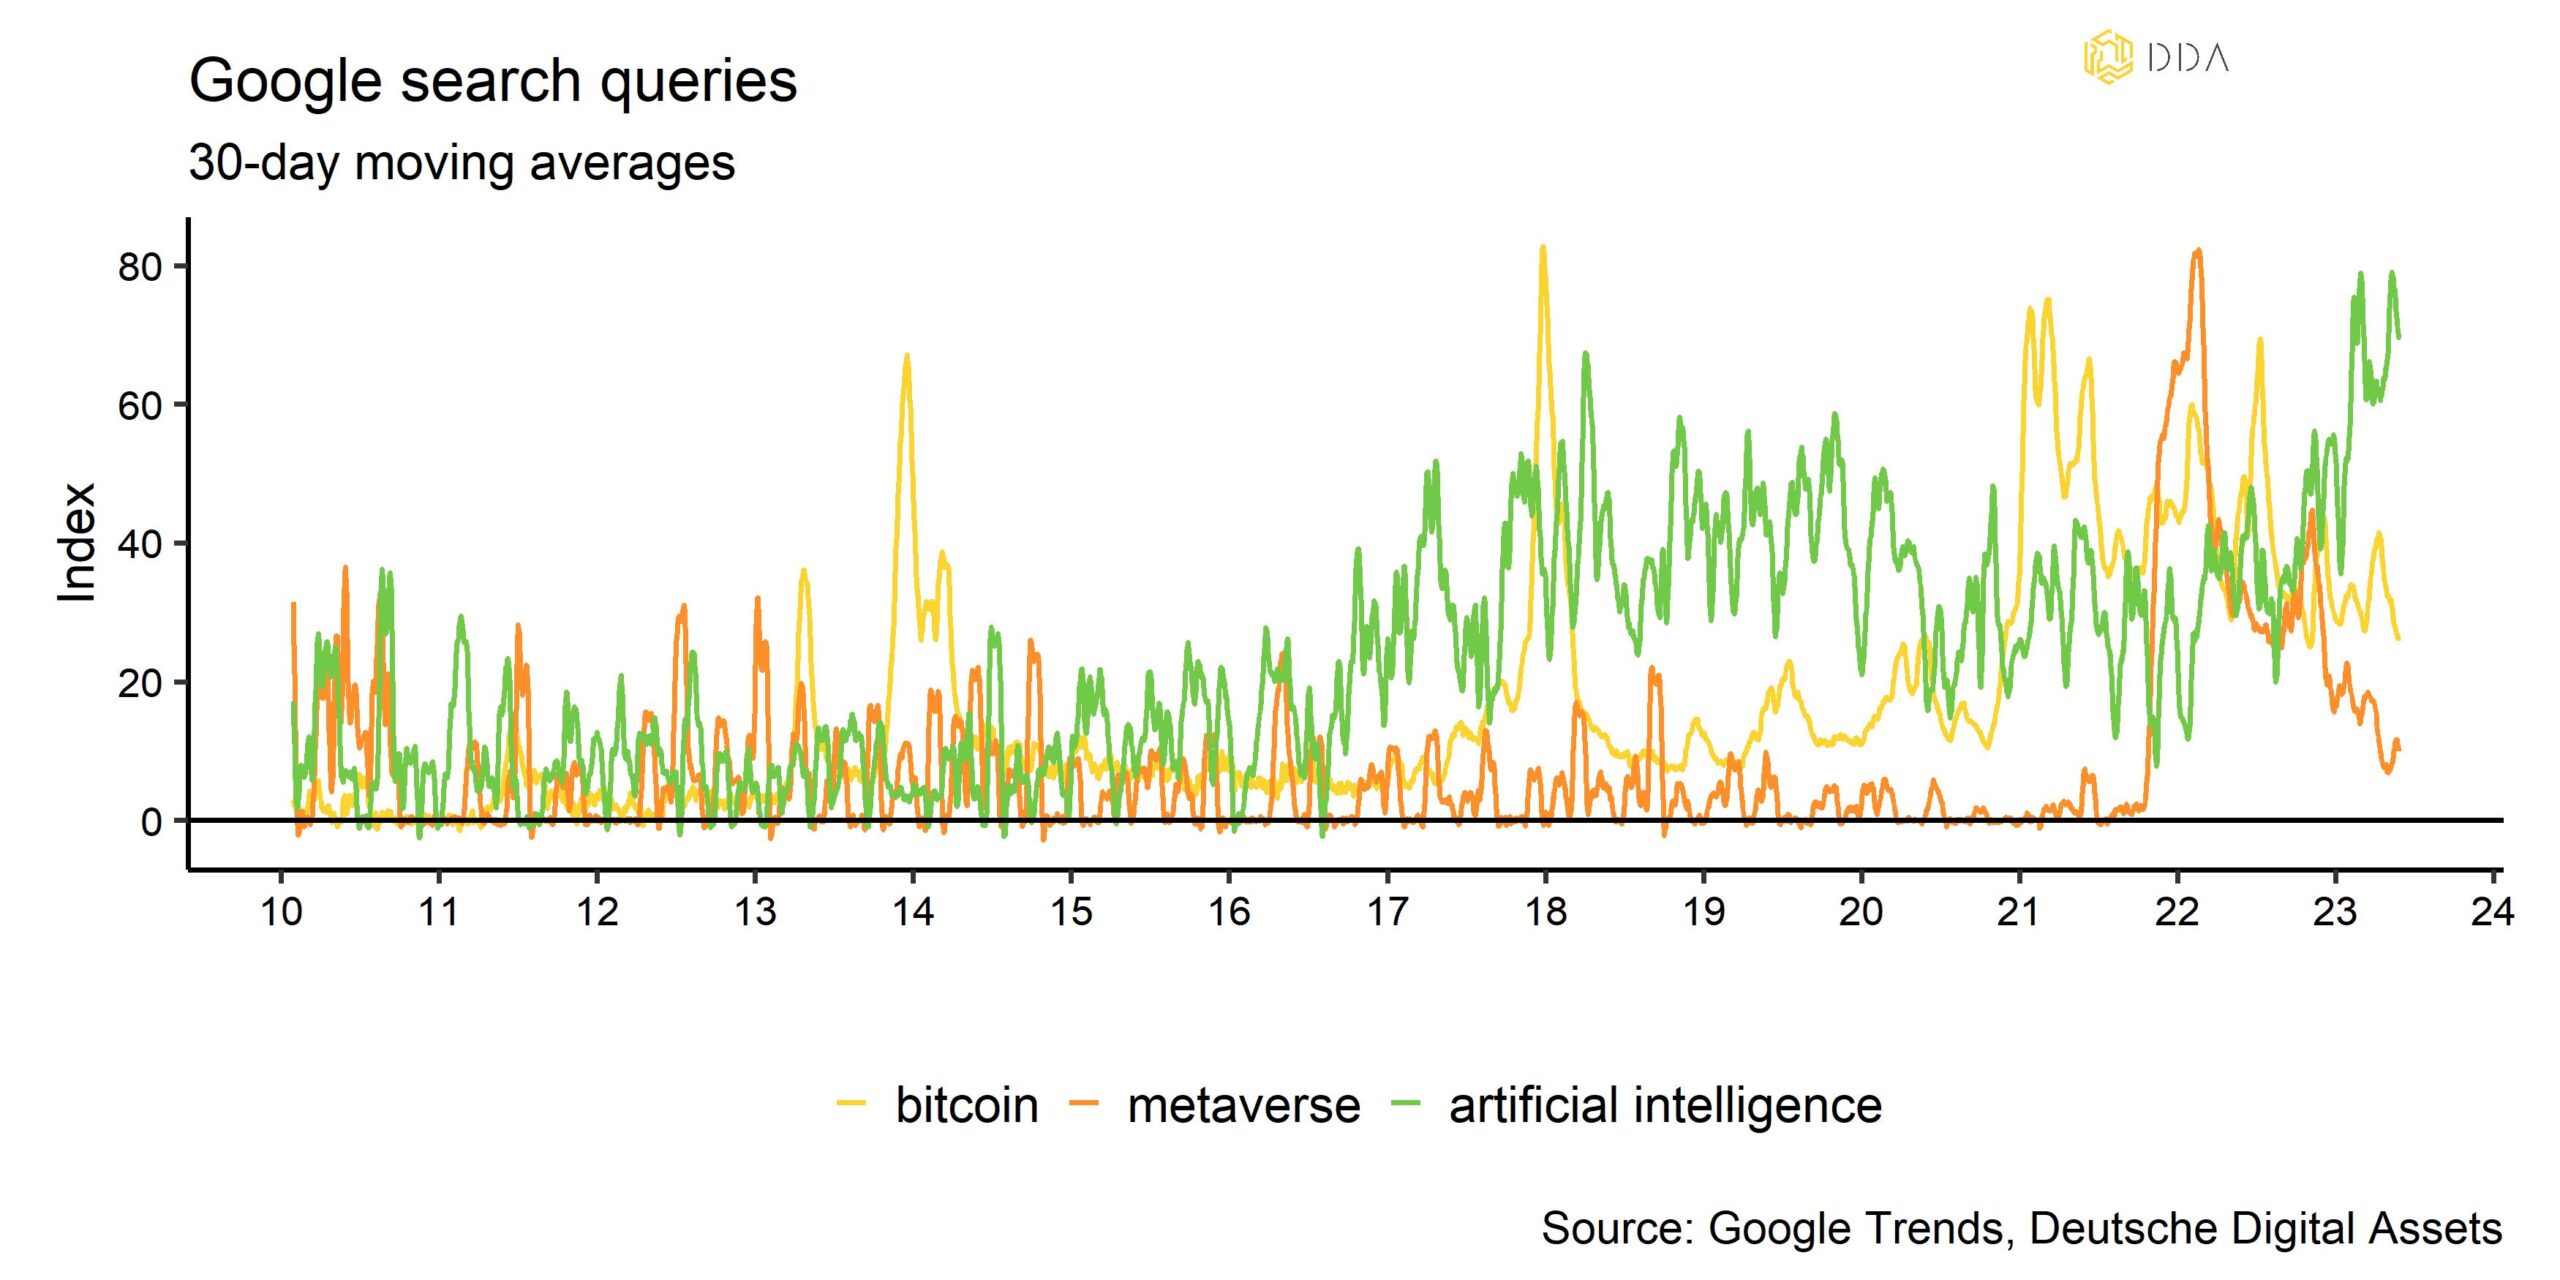
In contrast, search queries for “bitcoin” or “metaverse” do not signal any kind of exuberance at the moment.
Meanwhile, Nvidia’s stock price is trading at a lofty 23 times sales and 53 earnings times per share (12-months forward basis) while the average for the S&P 500 is 2.3 sales and 18.4 earnings, respectively. At the time of writing, Nvidia is the 4th biggest company in the S&P 500 and 3rd biggest company in the NASDAQ.
Moreover, fewer and fewer stocks have been outperforming the overall index with only 20% of S&P 500 stocks beating the index over the last 3 months according to the latest numbers, so market breadth is very thin which is historically a pre-cursor to major market corrections.
We think the AI hype should rather be faded in the short term and therefore the recent crowding into this investment theme could lead to some short-term disappointments down the road.
With respect to cryptoassets, only minor coins have been directly exposed by the recent hype, many of which have a comparably small market cap.
Nonetheless, a major correction in AI beneficiary stocks could pose a risk for cryptoassets, too, especially if correlations start to increase again. The good news is that correlations of cryptoassets to traditional asset classes have recently declined significantly and are now at the lowest level in 2 years for US stocks.
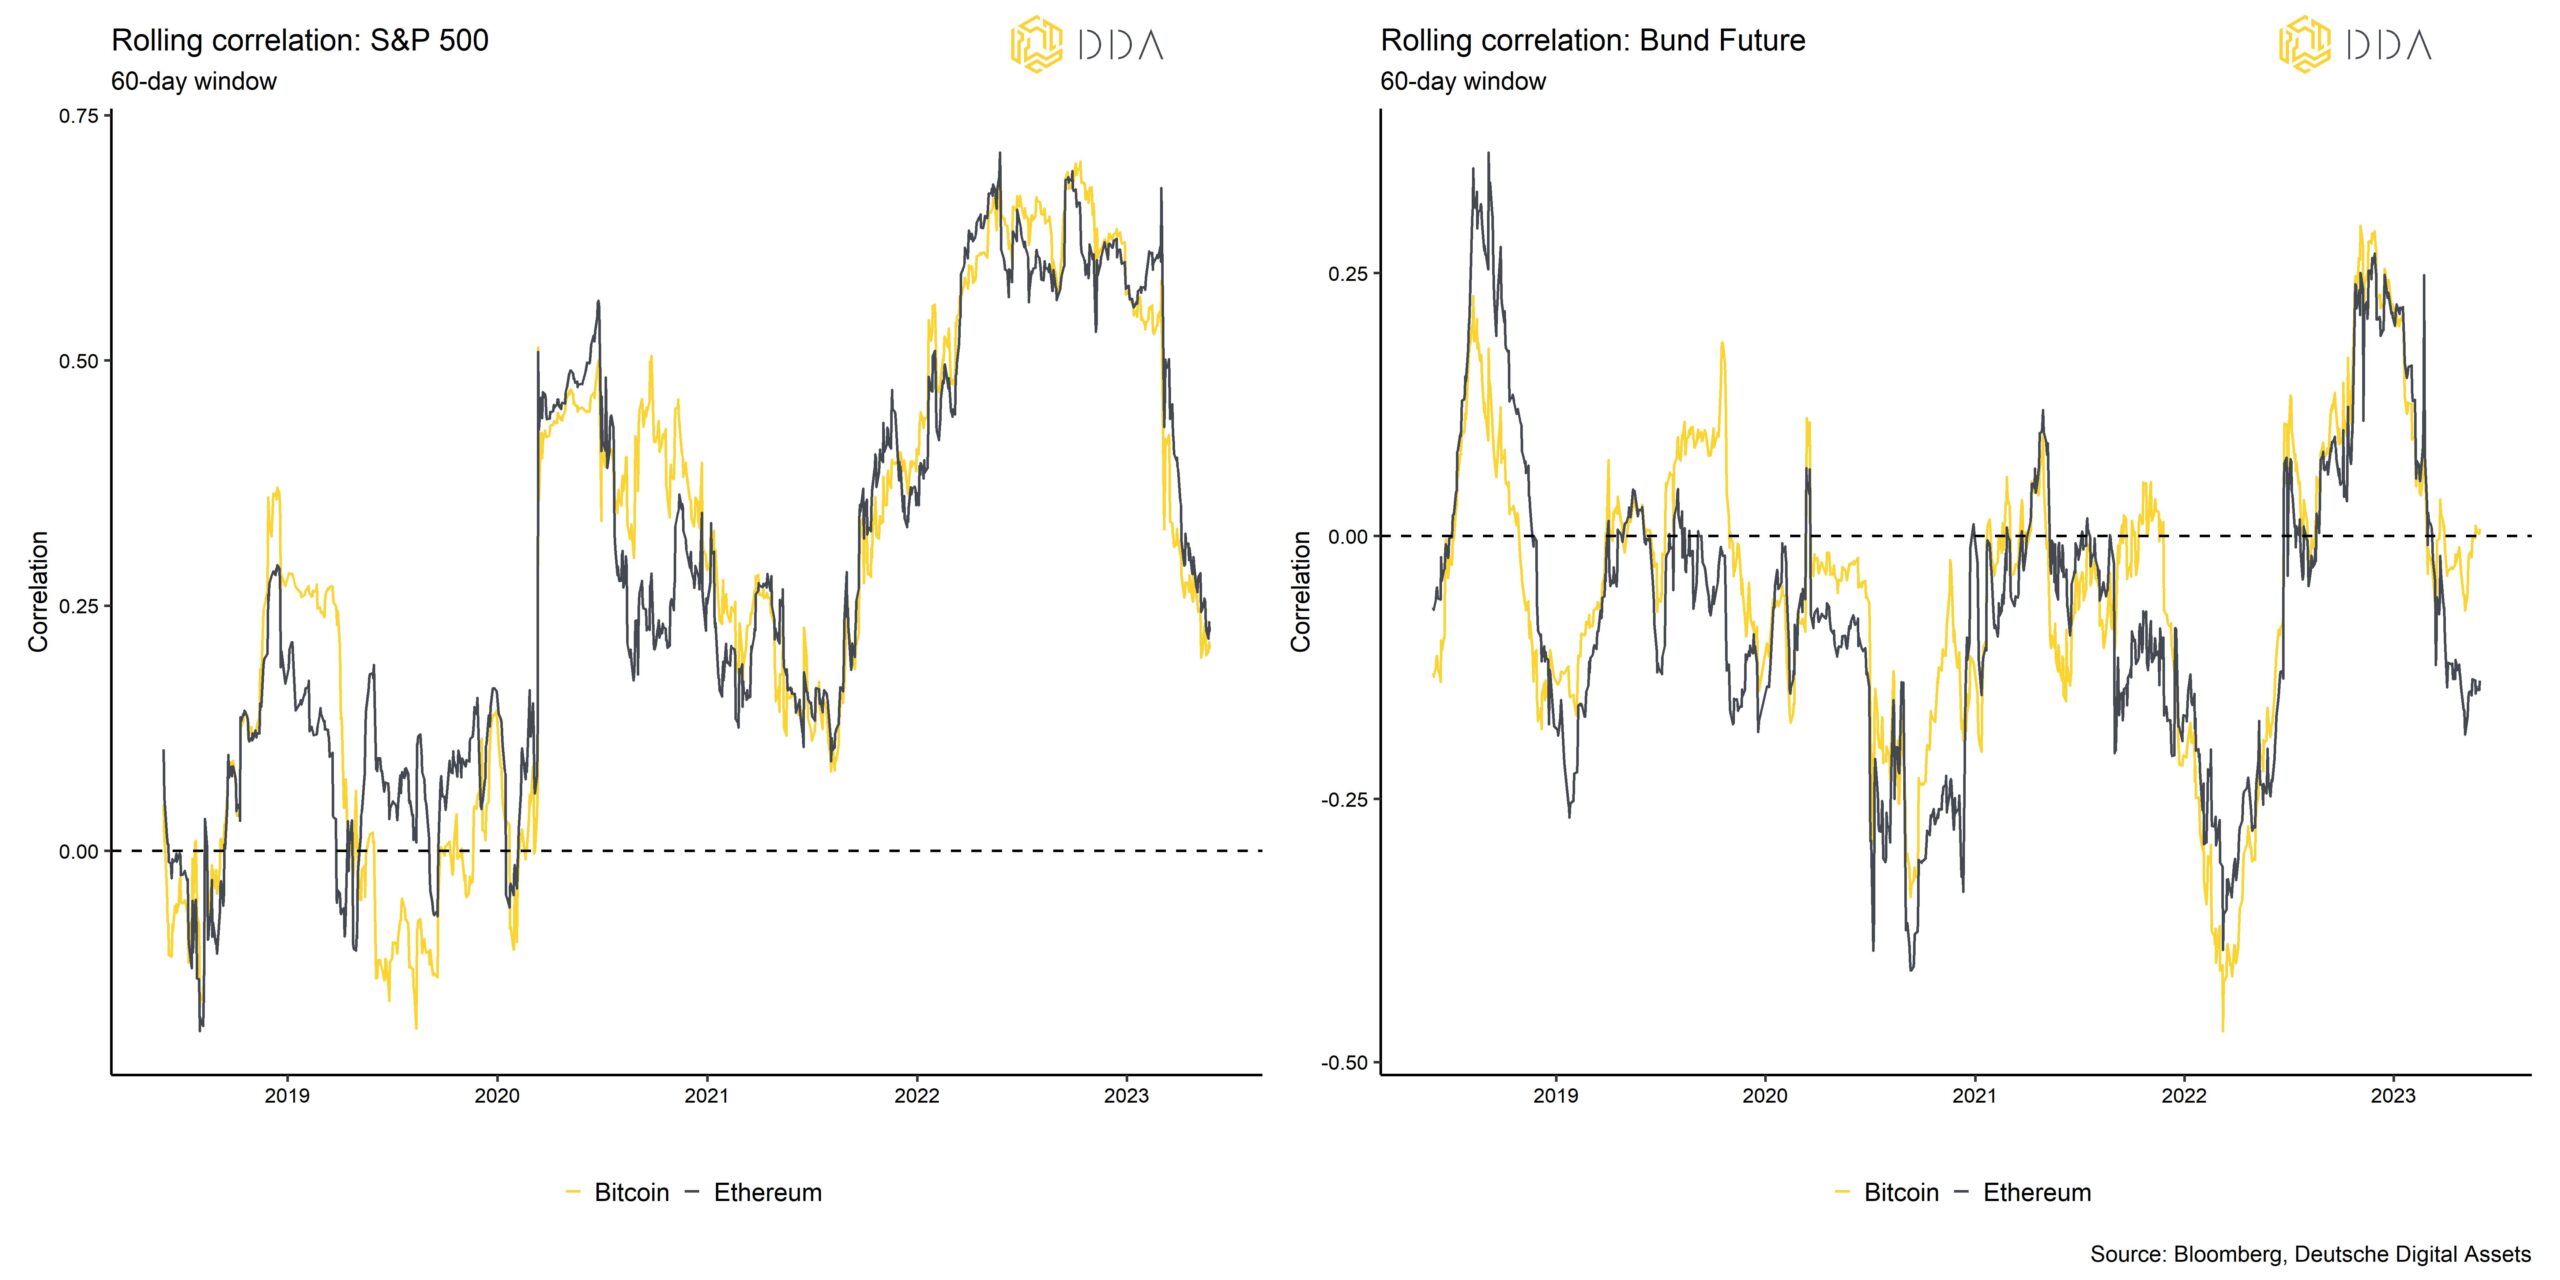
So, so for multi-asset investors, this implies that there have been increasing benefits by diversifying into cryptoassets as well.
Bottom Line: In the medium- to long term, both increasing fiscal debts and negative real interest rates are likely going to be a tailwind for cryptoassets. However, in the short term, a refill of the TGA at the Fed on account of the debt ceiling resolution could be headwind for cryptoassets due to a decline in overall net liquidity.
The recent AI craze could turn out to be a headwind for cryptoassets as this investment theme appears to be over-crowded/over-hyped in the short term. The good news is that correlations of cryptoassets to other traditional financial assets such as stocks or bonds have significantly declined recently.
On-Chain Analytics
The tug of war between bulls and bears continues as the market has been mired in a sideways/downside market for most of the month.
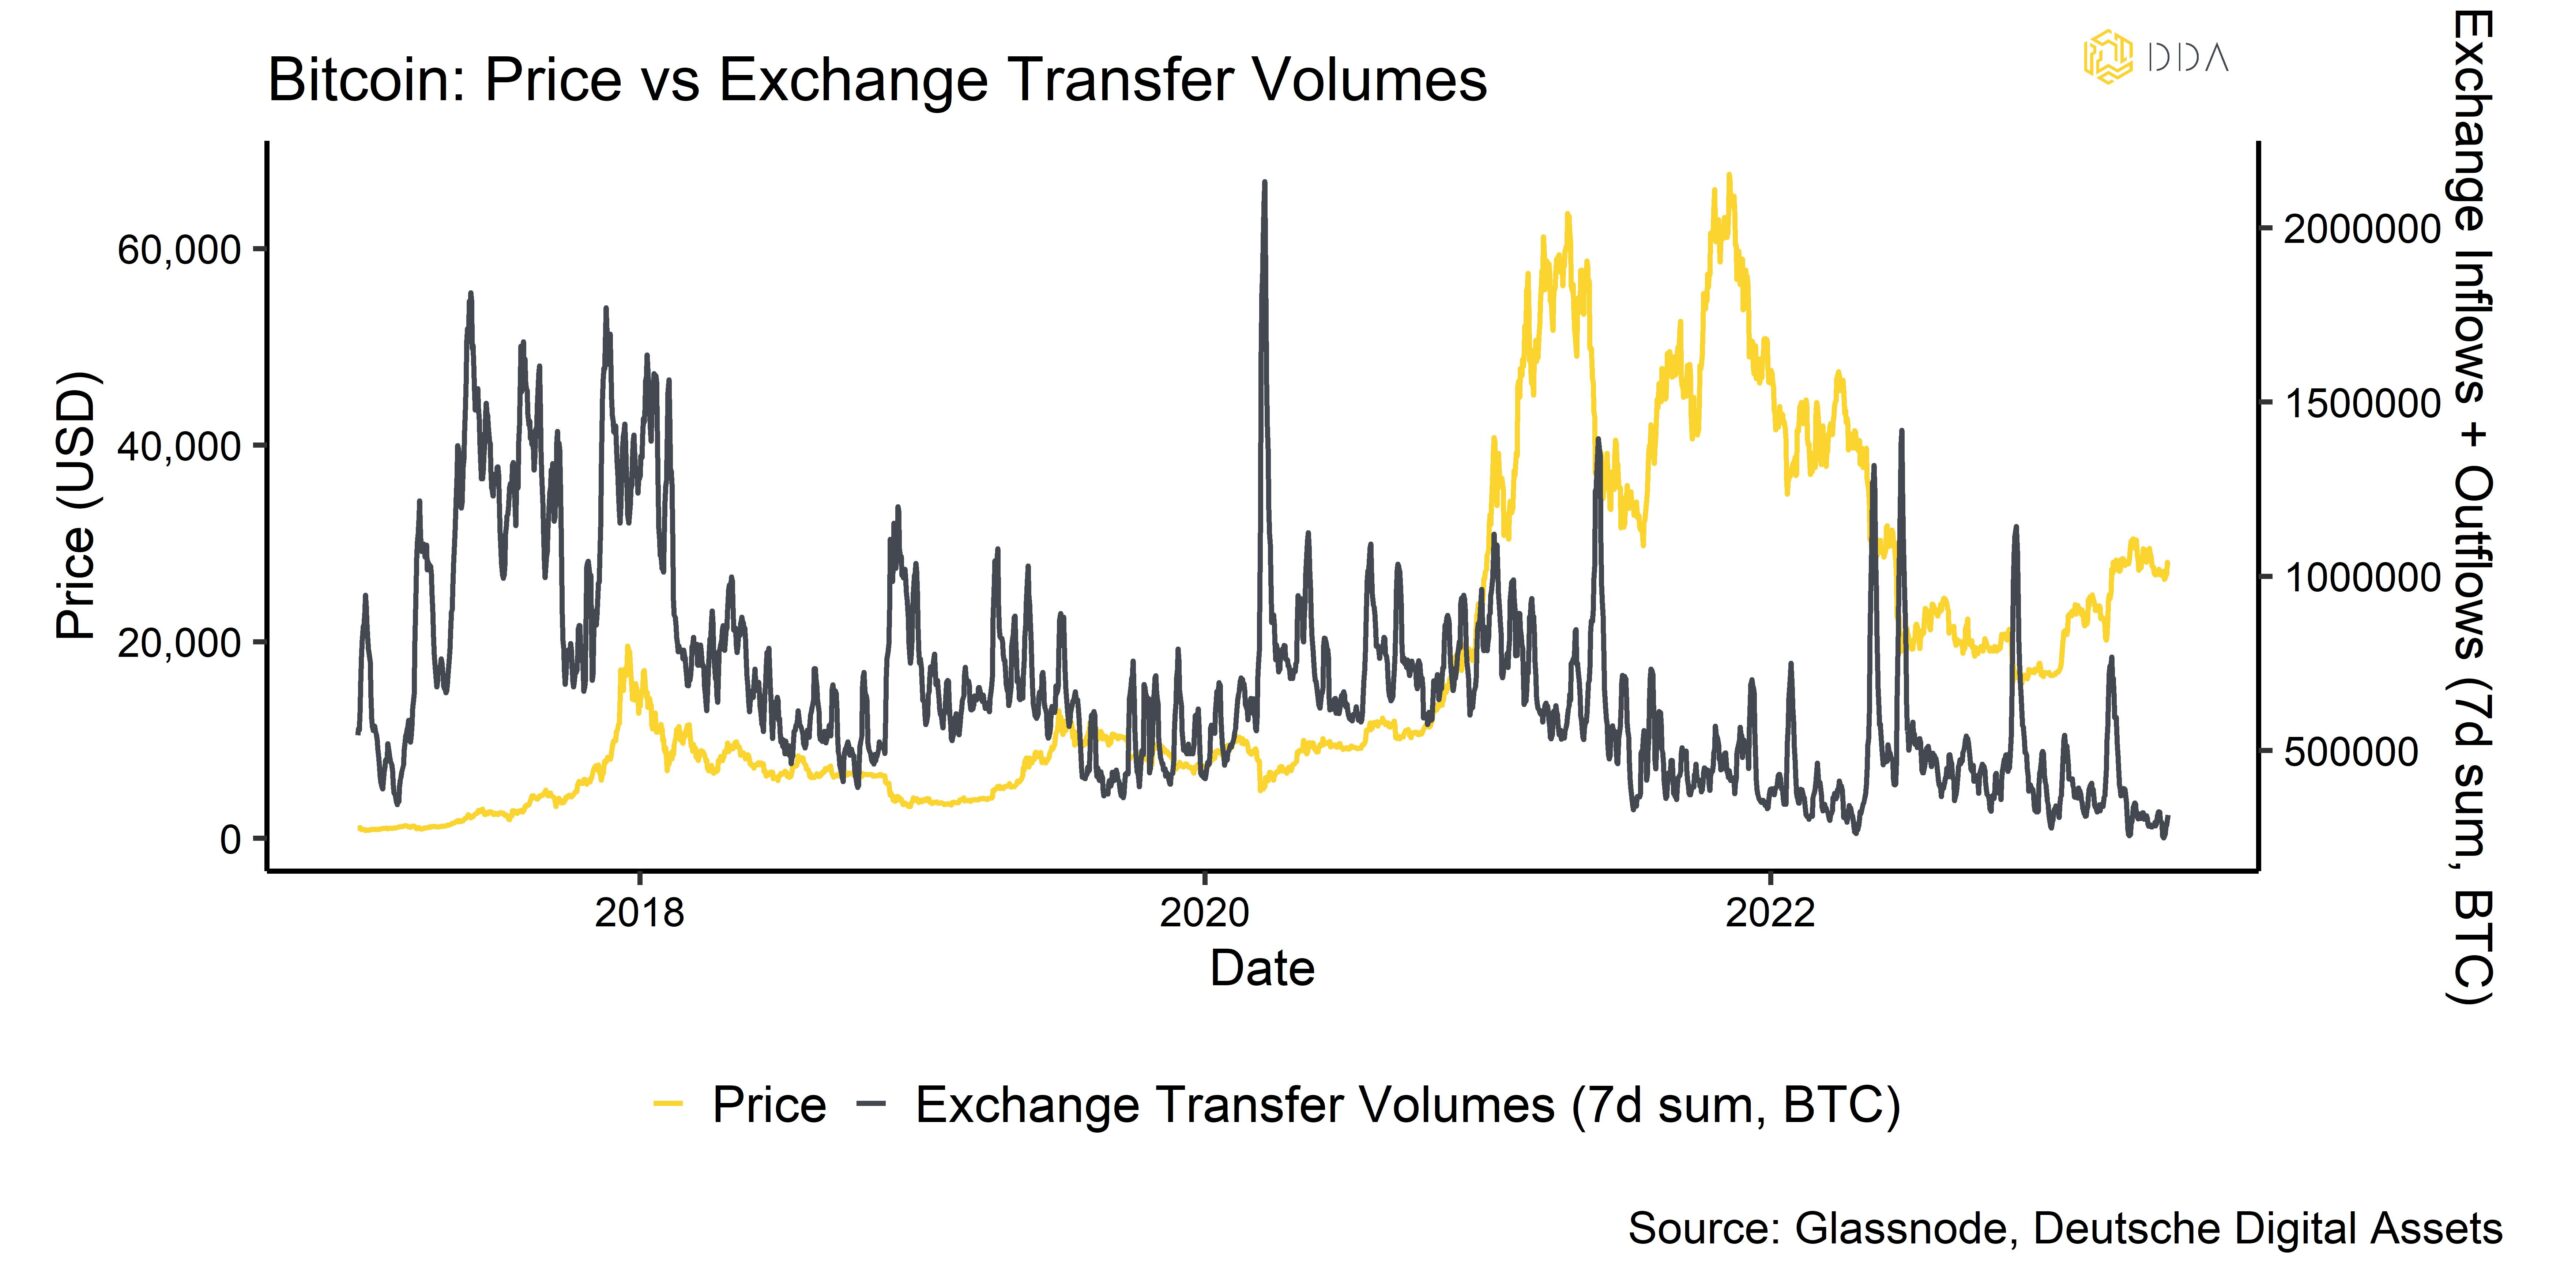
Bears point to the fact that liquidity has been decreasing throughout the month of May which is usually associated with bear markets. For instance, the transfer volume to and from exchanges for Bitcoin has been decreasing pointing to lower prices. From a macro point of view, overall liquidity has been on the decline due to ongoing Fed tightening and the anticipated TGA refill at the Fed which is going to further weigh on liquidity (see explanation above).
Low liquidity has also led to a compression in trading ranges and volatility during the month of May. For instance, Deribit’s DVOL index, which measures 1-month implied volatilities for Bitcoin options, has fallen to the lowest levels since beginning of the year. Besides, Bitcoin’s realized volatility has also dropped significantly. Such low-volatility regimes only account for 19% of Bitcoin’s price history, according to Glassnode.
Decreasing liquidity comes at a time when some important network metrics have been declining as well due to high transaction fees that have deterred many users from transacting via Bitcoin. Core on-chain metrics such as active addresses and new addresses had declined significantly due to the congestion of the Bitcoin network which appeared to be due to an increasing usage of inscriptions to mint BRC-20 tokens on the Bitcoin blockchain.
The degree of congestion in the Bitcoin network has gradually declined again but is still elevated compared to the pre-April period. This can also be seen at the number of transactions in the Bitcoin mempool waiting to be picked up by miners:
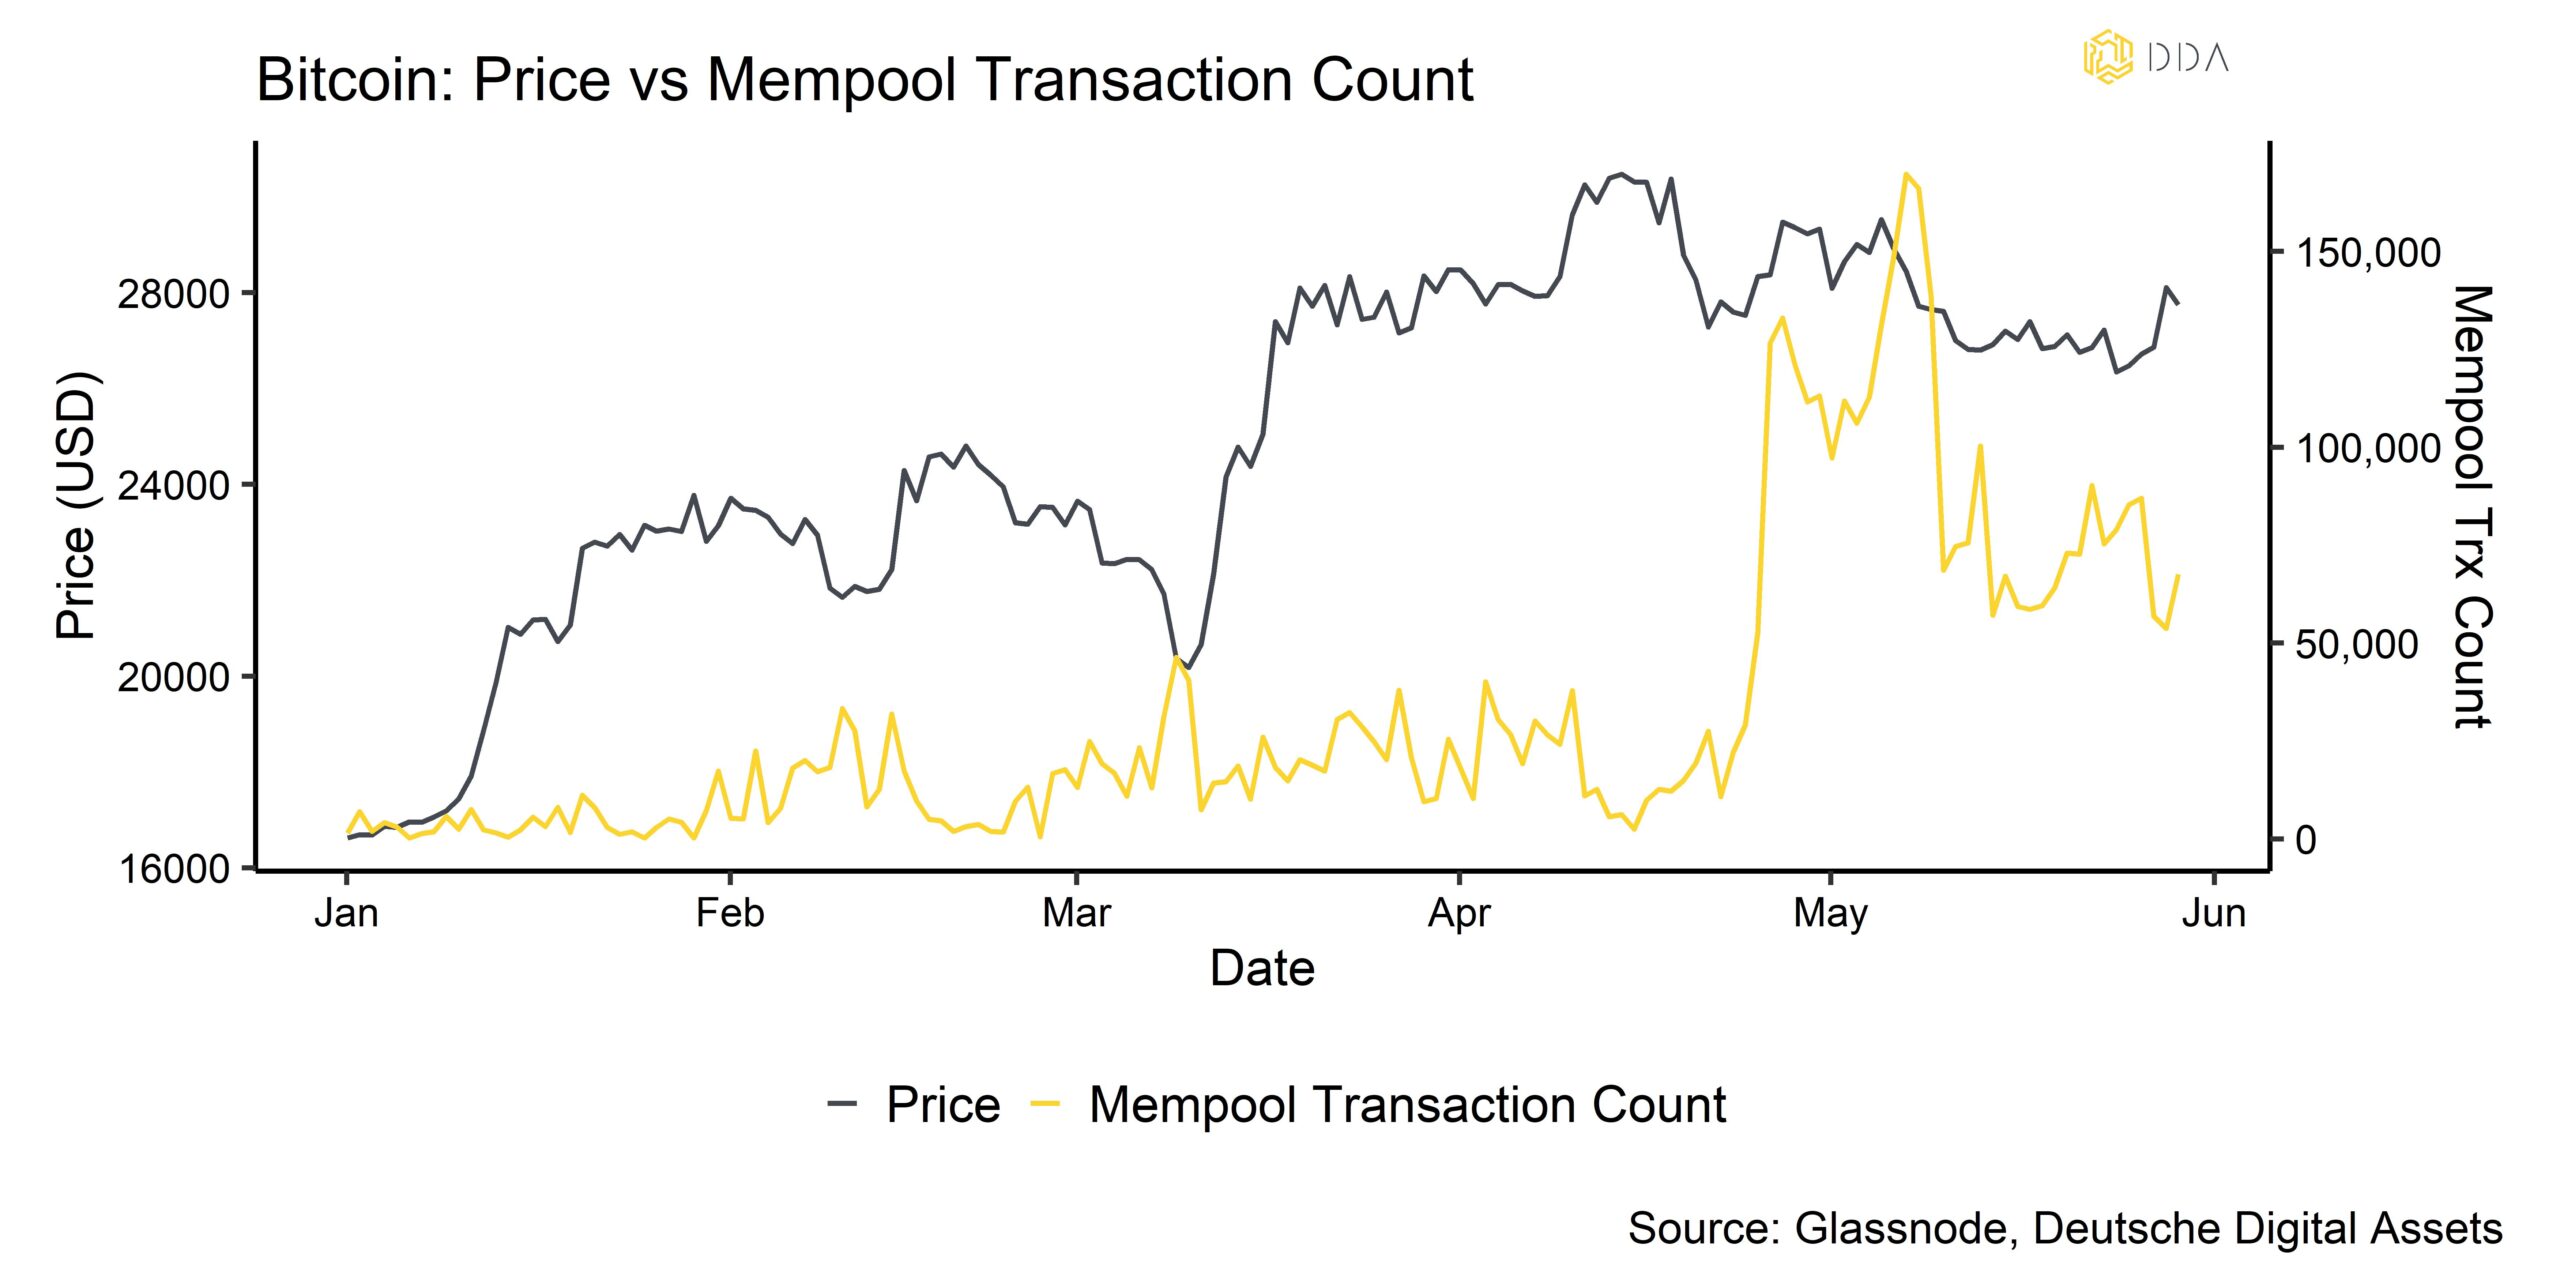
Through the Ordinals protocol, the BRC-20 experimental token standard enables the production and transfer of fungible tokens on the Bitcoin network. It was established in March 2023 to make it possible to mint tokens for use with Bitcoin. At some point during May, the aggregate market cap of BRC-20 tokens reached 1 bn USD. Among these BRC-20 tokens, the most popular tokens are ORDI, PEPE, and MEME.
That being said, there were important divergences taking place in core on-chain metrics: While active addresses had plummeted, other metrics like total transaction count or the total block size reached new all-time highs on the Bitcoin blockchain last month. This is also one of the reasons why our in-house measure of overall Bitcoin network activity is still hovering near its all-time highs.
The same is true for both Bitcoin hash rate and difficulty which have risen to fresh all-time highs as well.
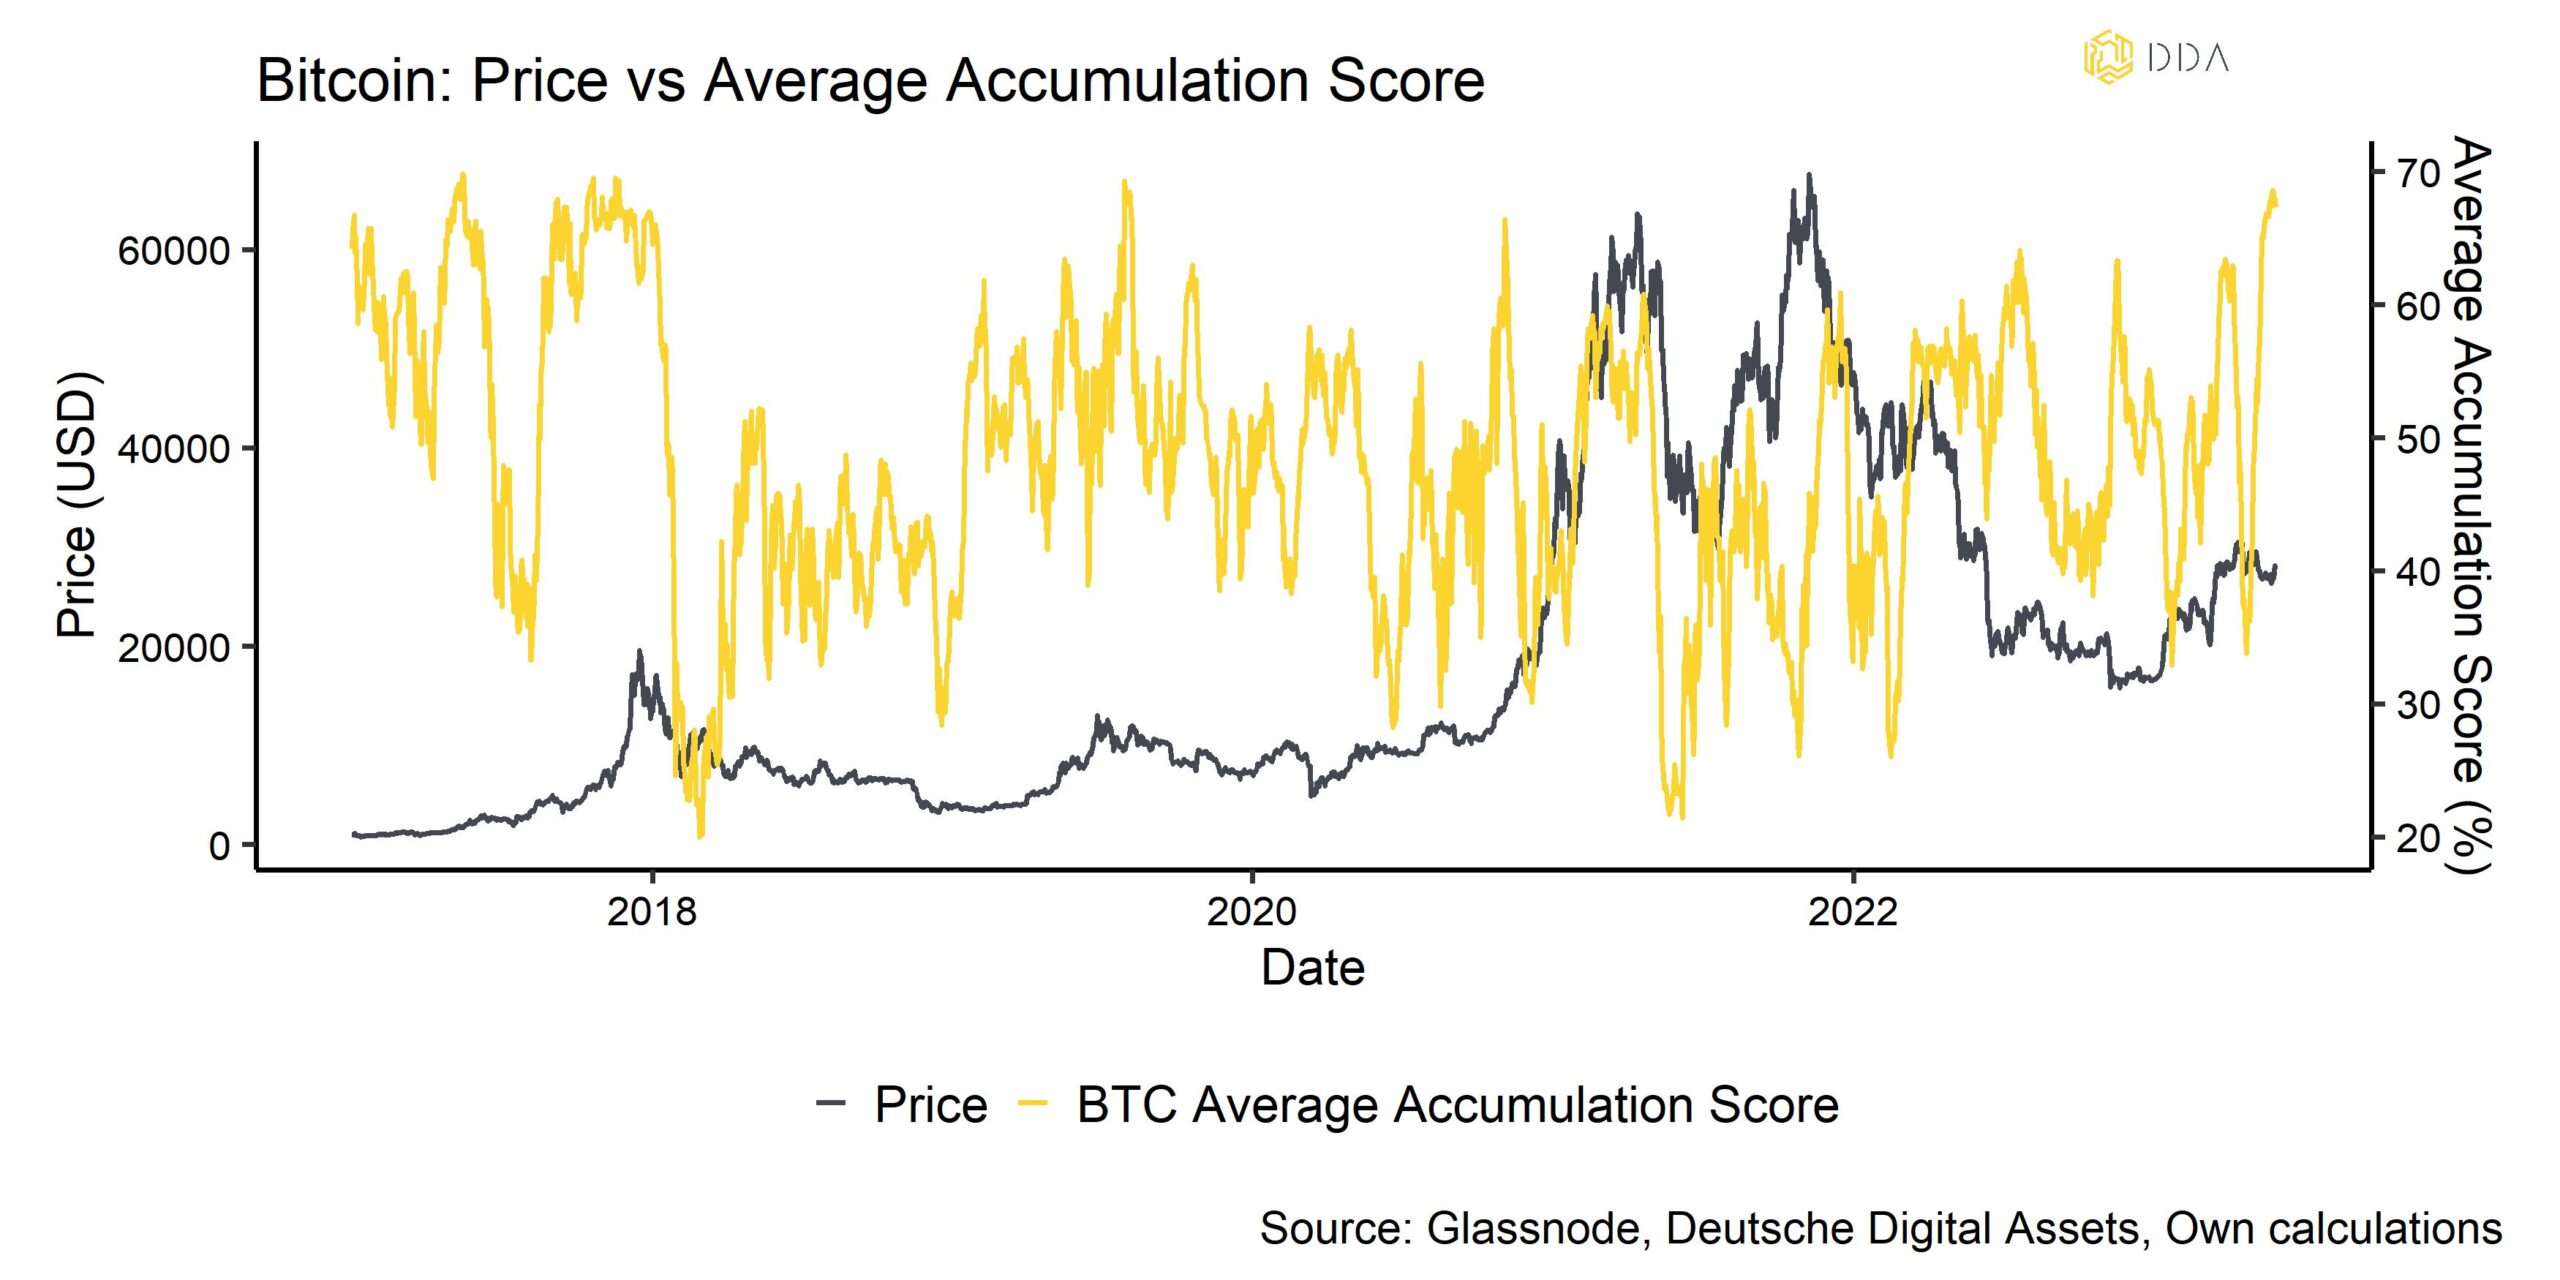
Moreover, bulls point out that recent price corrections have been used by larger investors to accumulate more coins. In fact, the month of May has seen largest net exchange outflows since December 2022, when we saw very high accumulation activity.
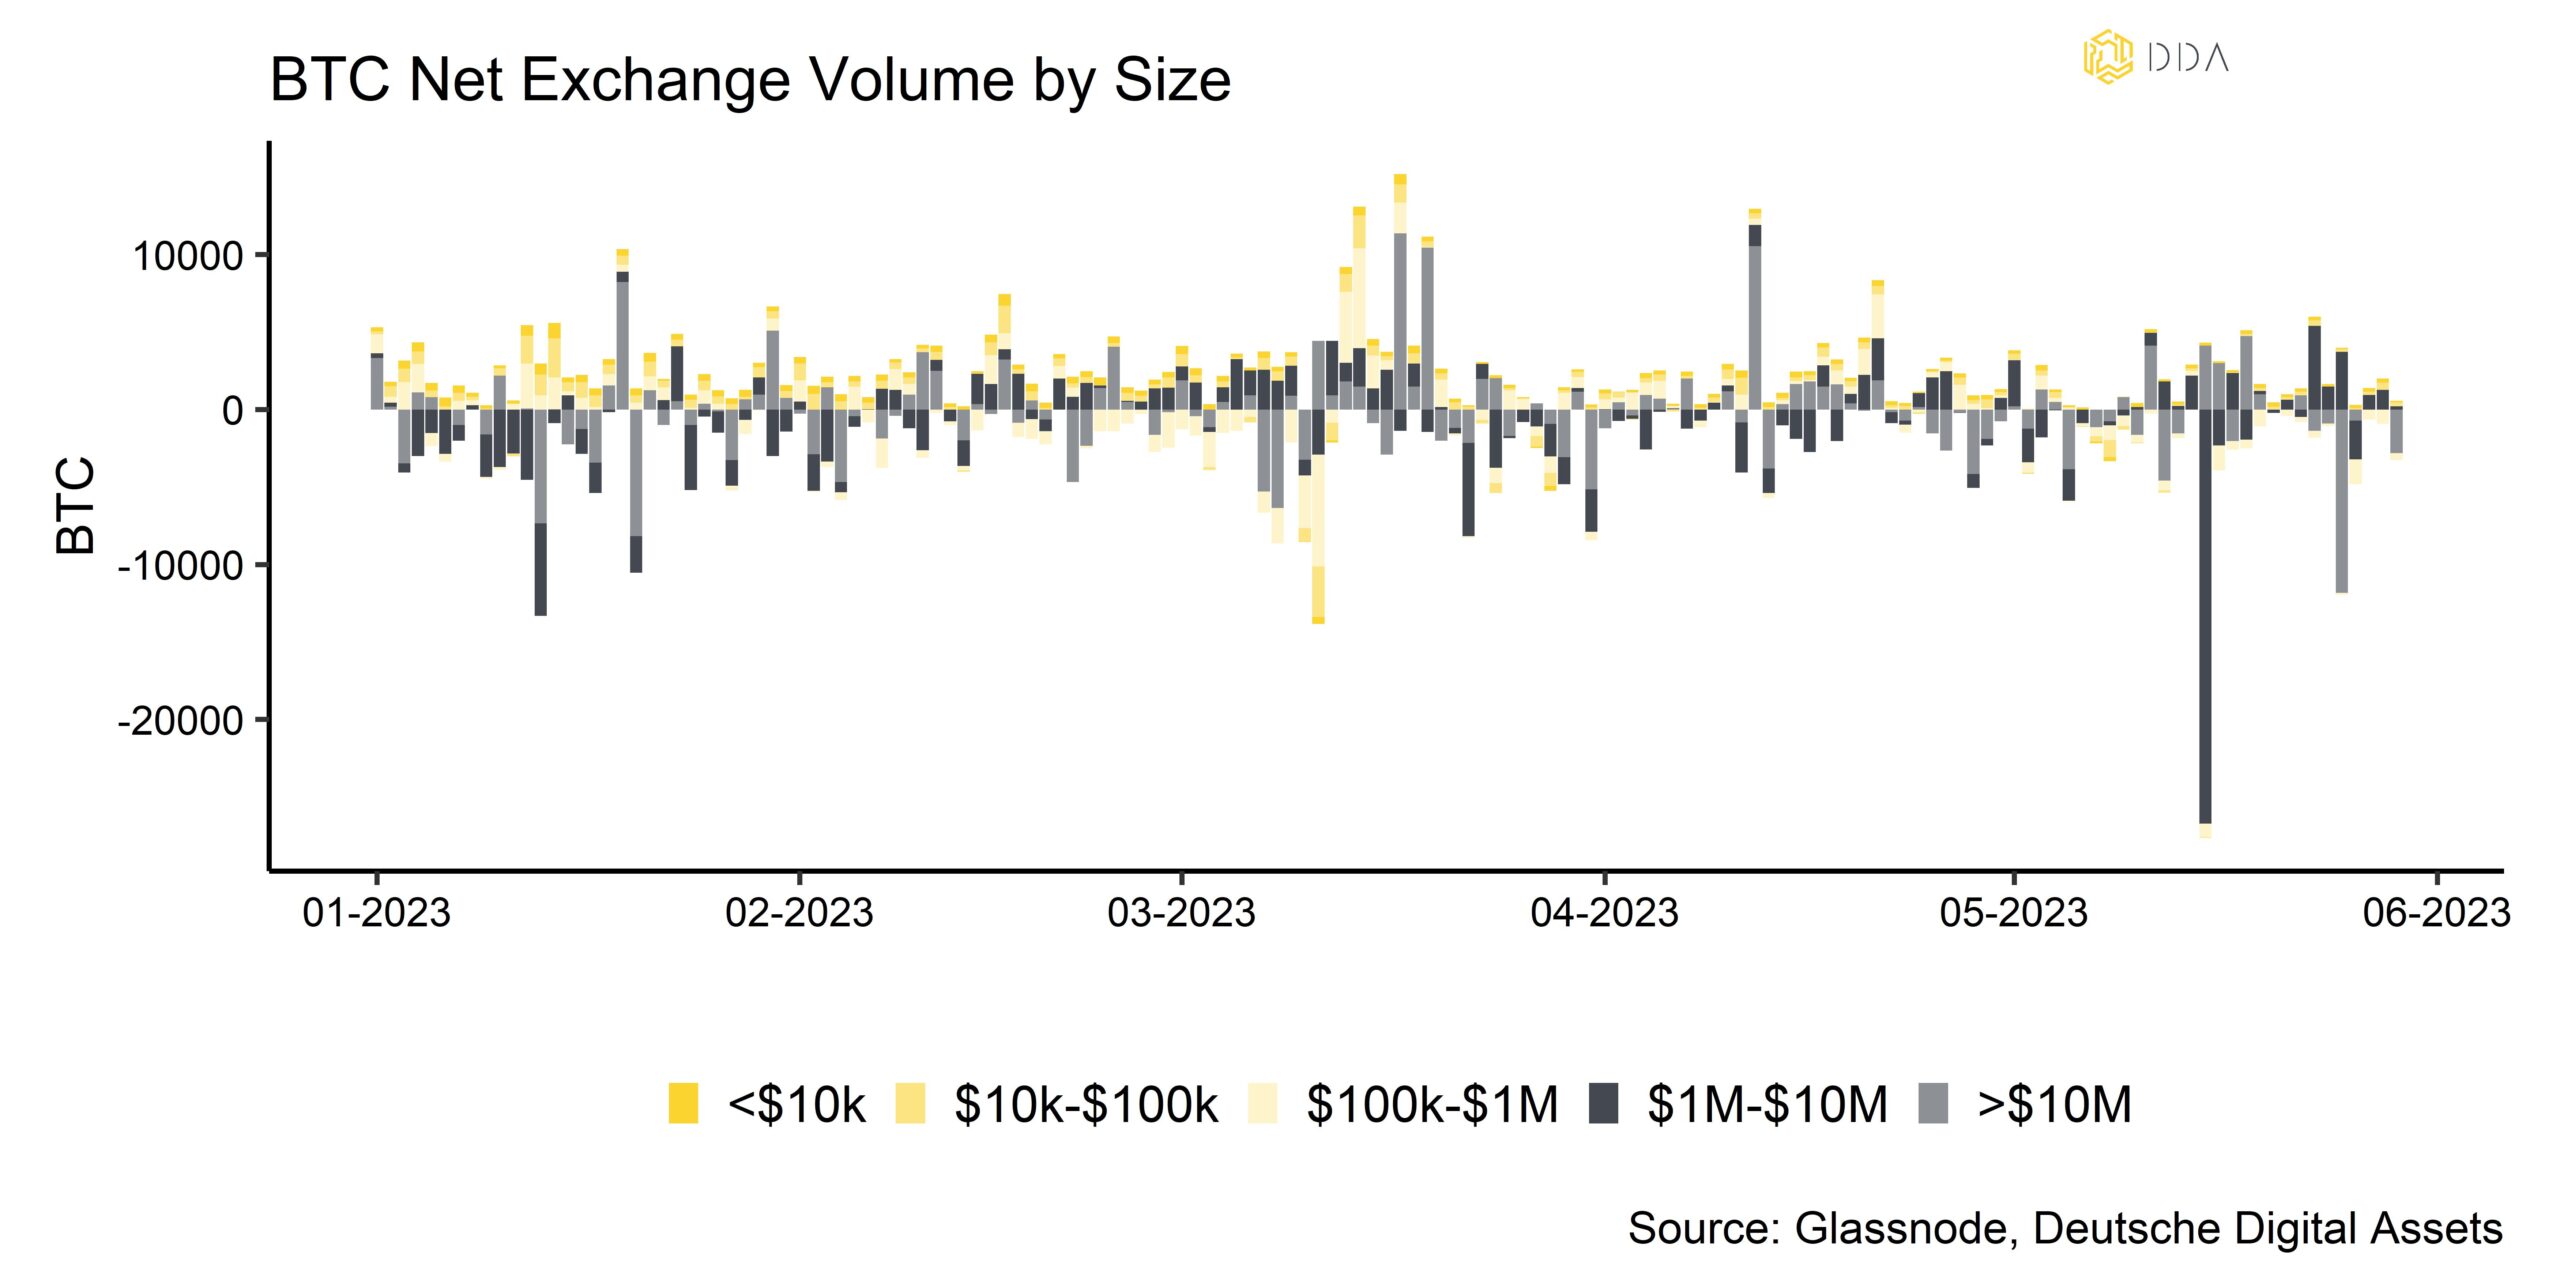
Despite some gloominess in the market right now, some large institutional buyers appear to support prices at these levels. The outsized Bitcoin exchange outflow from Coinbase in mid-May implies large institutional buying interest at these lower levels. In fact, it was the largest exchange outflow from Coinbase year-to-date.
Moreover, Tuesday last week (25/5/23) saw the largest exchange outflow by wallet size of more than 10 mn USD. Exchange outflows are interpreted as increasing buying pressure as especially larger investors usually take their coins off exchange to store them in “cold storage”.Moreover, our in-house measure of average accumulation score across various wallet cohorts has increased to the highest level since 2017 which should at least put a floor under prices (Chart-of-the-Month). After a brief period of distribution, Bitcoin wallets have on average returned to a very high level of accumulation activity again.

This is mainly due to an increase in accumulation activity in smaller wallet cohorts (up to 1 BTC) and larger wallet cohorts (100 to 100k BTC) as well.
All in all, this points to limited downside risks despite declining liquidity.
Bottom Line: Declining liquidity has mainly led to compression in trading ranges and volatilities. Congestion in the Bitcoin network has gradually decreased again but remains relatively elevated. Despite some gloominess in the market right now, some large institutional buyers appear to support prices at these levels which is evident in the high degree of accumulation activity at the moment.
About Deutsche Digital Assets
Deutsche Digital Assets is the trusted one-stop-shop for investors seeking exposure to crypto assets. We offer a menu of crypto investment products and solutions, ranging from passive to actively managed exposure, as well as financial product white-labeling services for asset managers.
We deliver excellence through familiar, trusted investment vehicles, providing investors the quality assurances they deserve from a world-class asset manager as we champion our mission of driving crypto asset adoption. DDA removes the technical risks of crypto investing by offering investors trusted and familiar means to invest in crypto at industry-leading low costs.
Legal Disclaimer
The material and information contained in this article is for informational purposes only. Deutsche Digital Assets, its affiliates, and subsidiaries are not soliciting any action based upon such material. This article is neither investment advice nor a recommendation or solicitation to buy any securities. Performance is unpredictable. Past performance is hence not an indication of any future performance. You agree to do your own research and due diligence before making any investment decision with respect to securities or investment opportunities discussed herein. Our articles and reports include forward-looking statements, estimates, projections, and opinions. These may prove to be substantially inaccurate and are inherently subject to significant risks and uncertainties beyond Deutsche Digital Assets GmbH’s control. We believe all information contained herein is accurate, reliable and has been obtained from public sources. However, such information is presented “as is” without warranty of any kind.