
Crypto Market Intelligence July 2023
by André Dragosch, Head of Research
Key Takeaways
- Cryptoassets posted a positive performance in June due to Blackrock’s ETF filing that has sparked a new wave of optimism among cryptoasset investors
- Decline in US regulatory uncertainty, institutional fund flows and Fed’s hiking pause dominate the macro picture
- Approximately +14.8 bn USD have already flown into Bitcoin this year most of which have been on-chain inflows
Chart of the month
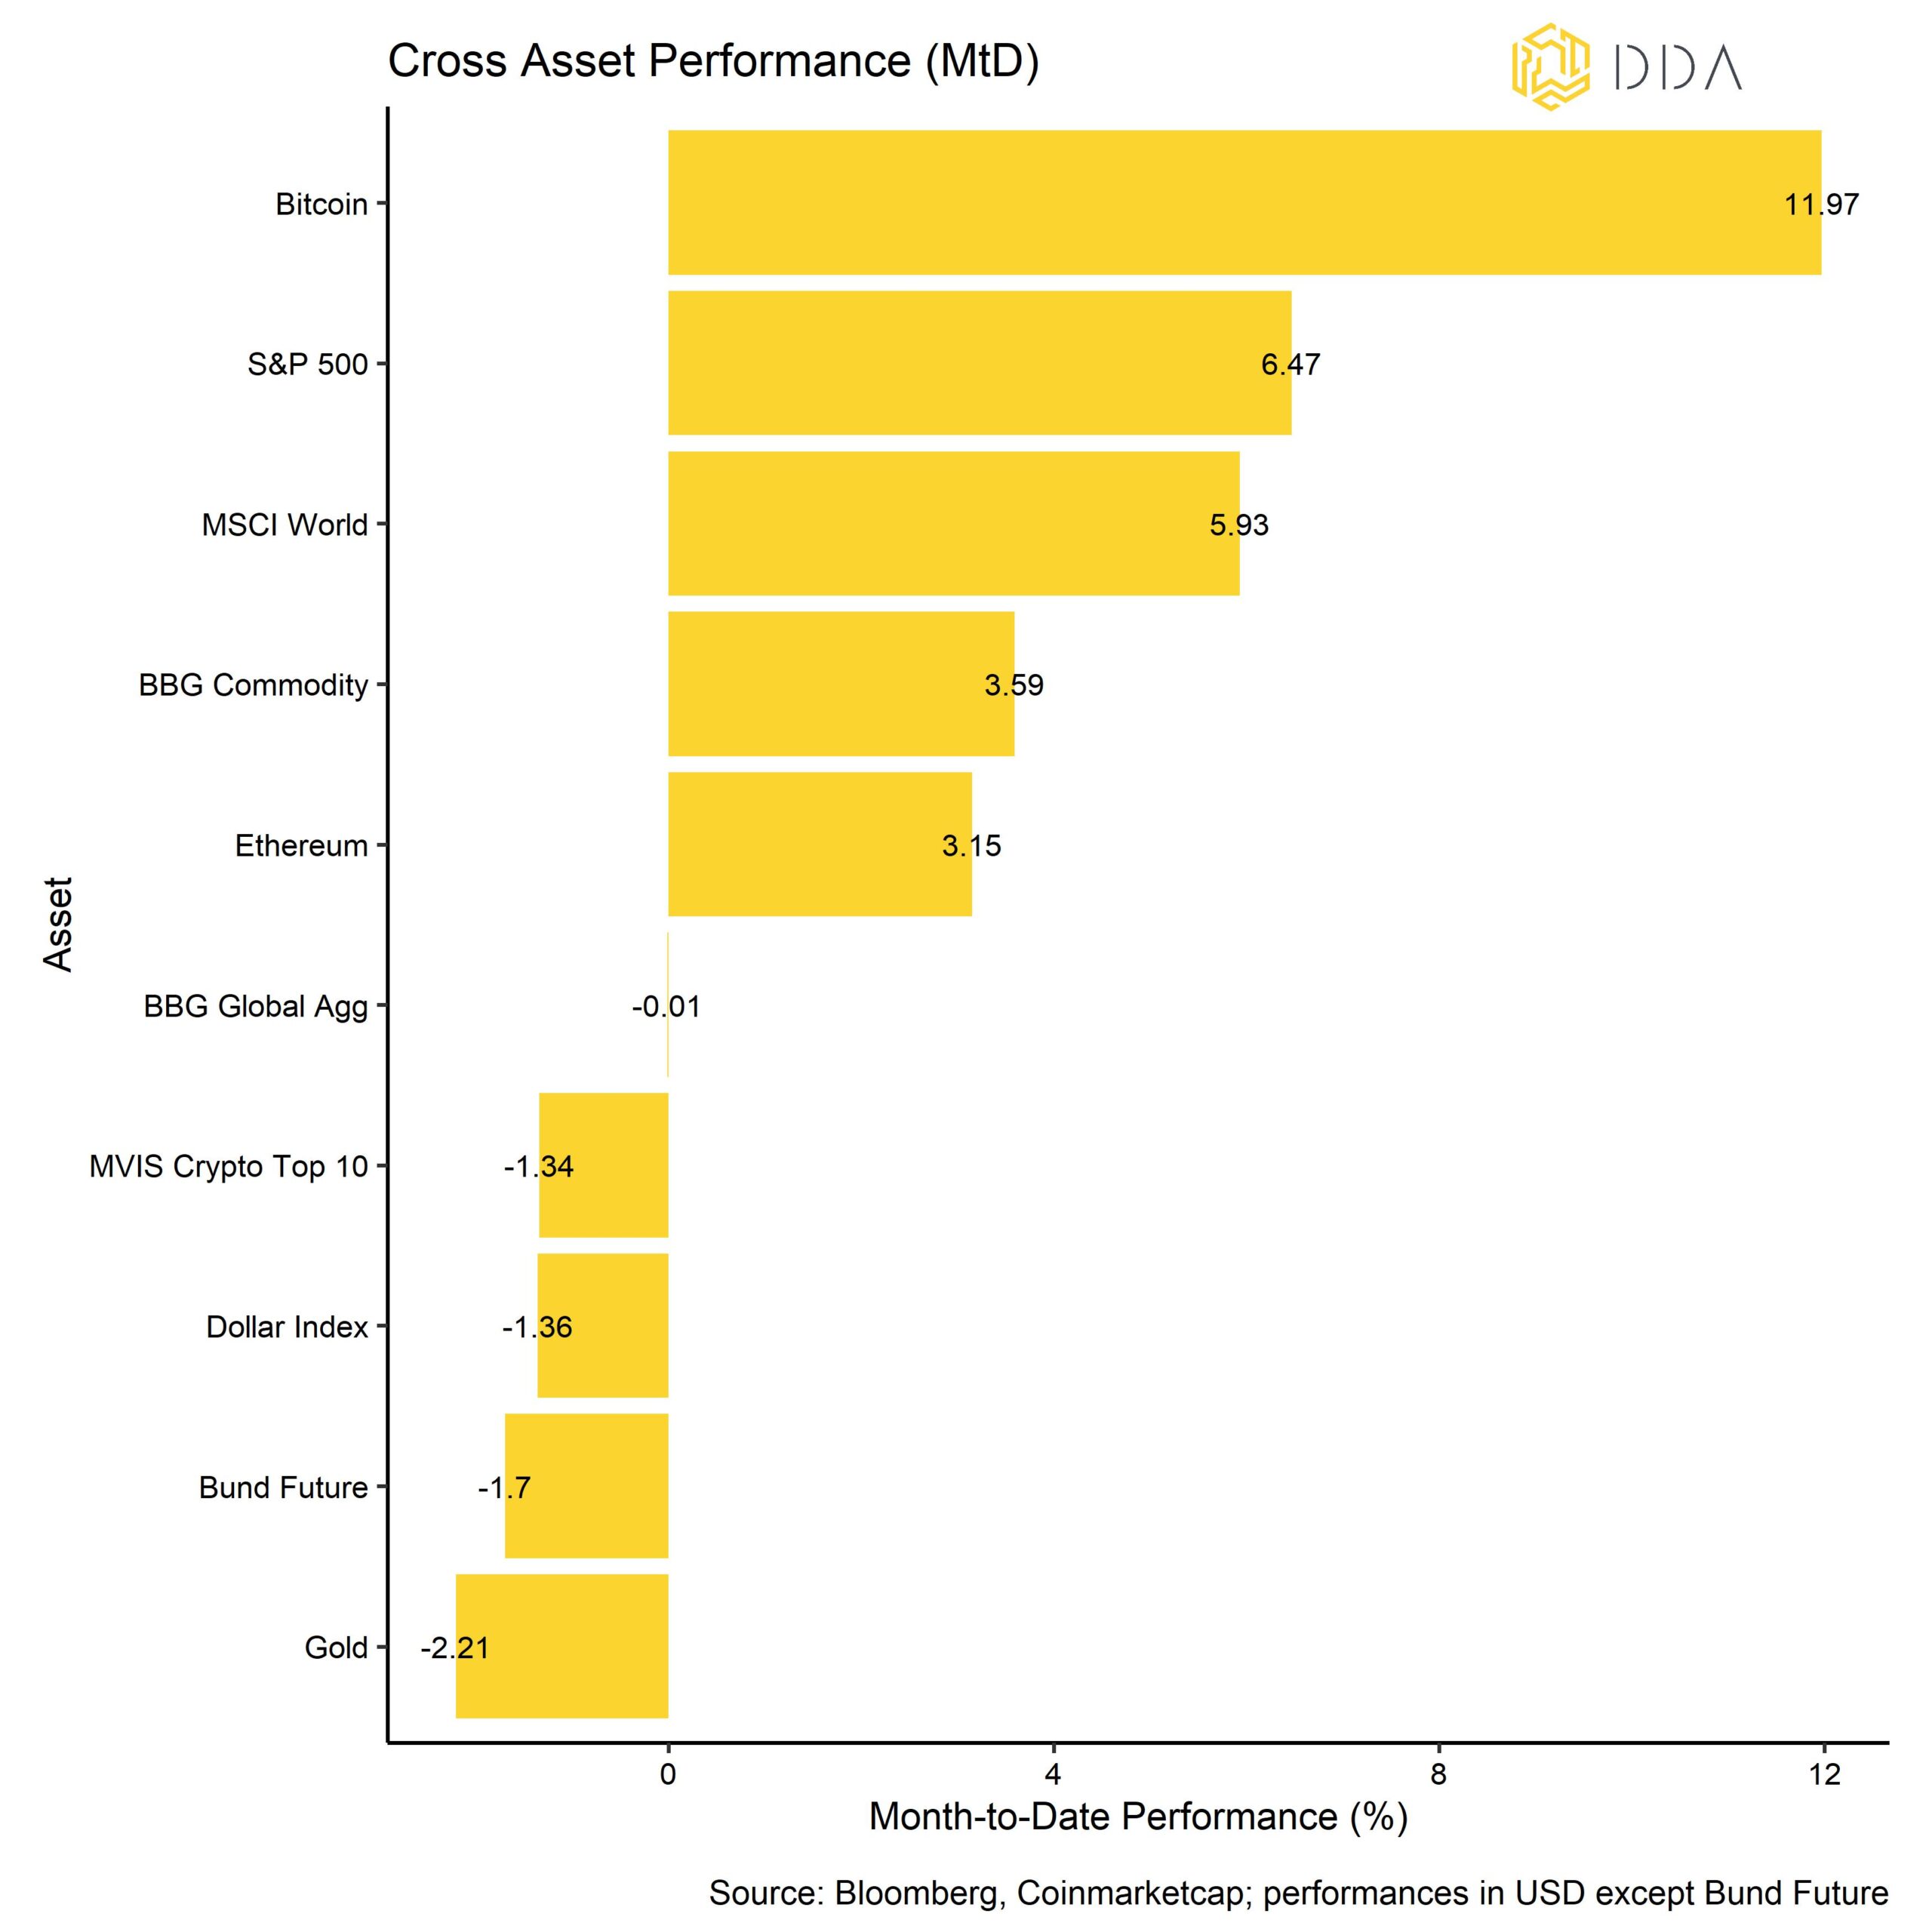
Cryptoasset Performance
Cryptoassets posted a positive performance in June mainly due to Blackrock’s Bitcoin Trust filing in the US that has sparked a new wave of optimism among cryptoasset investors.
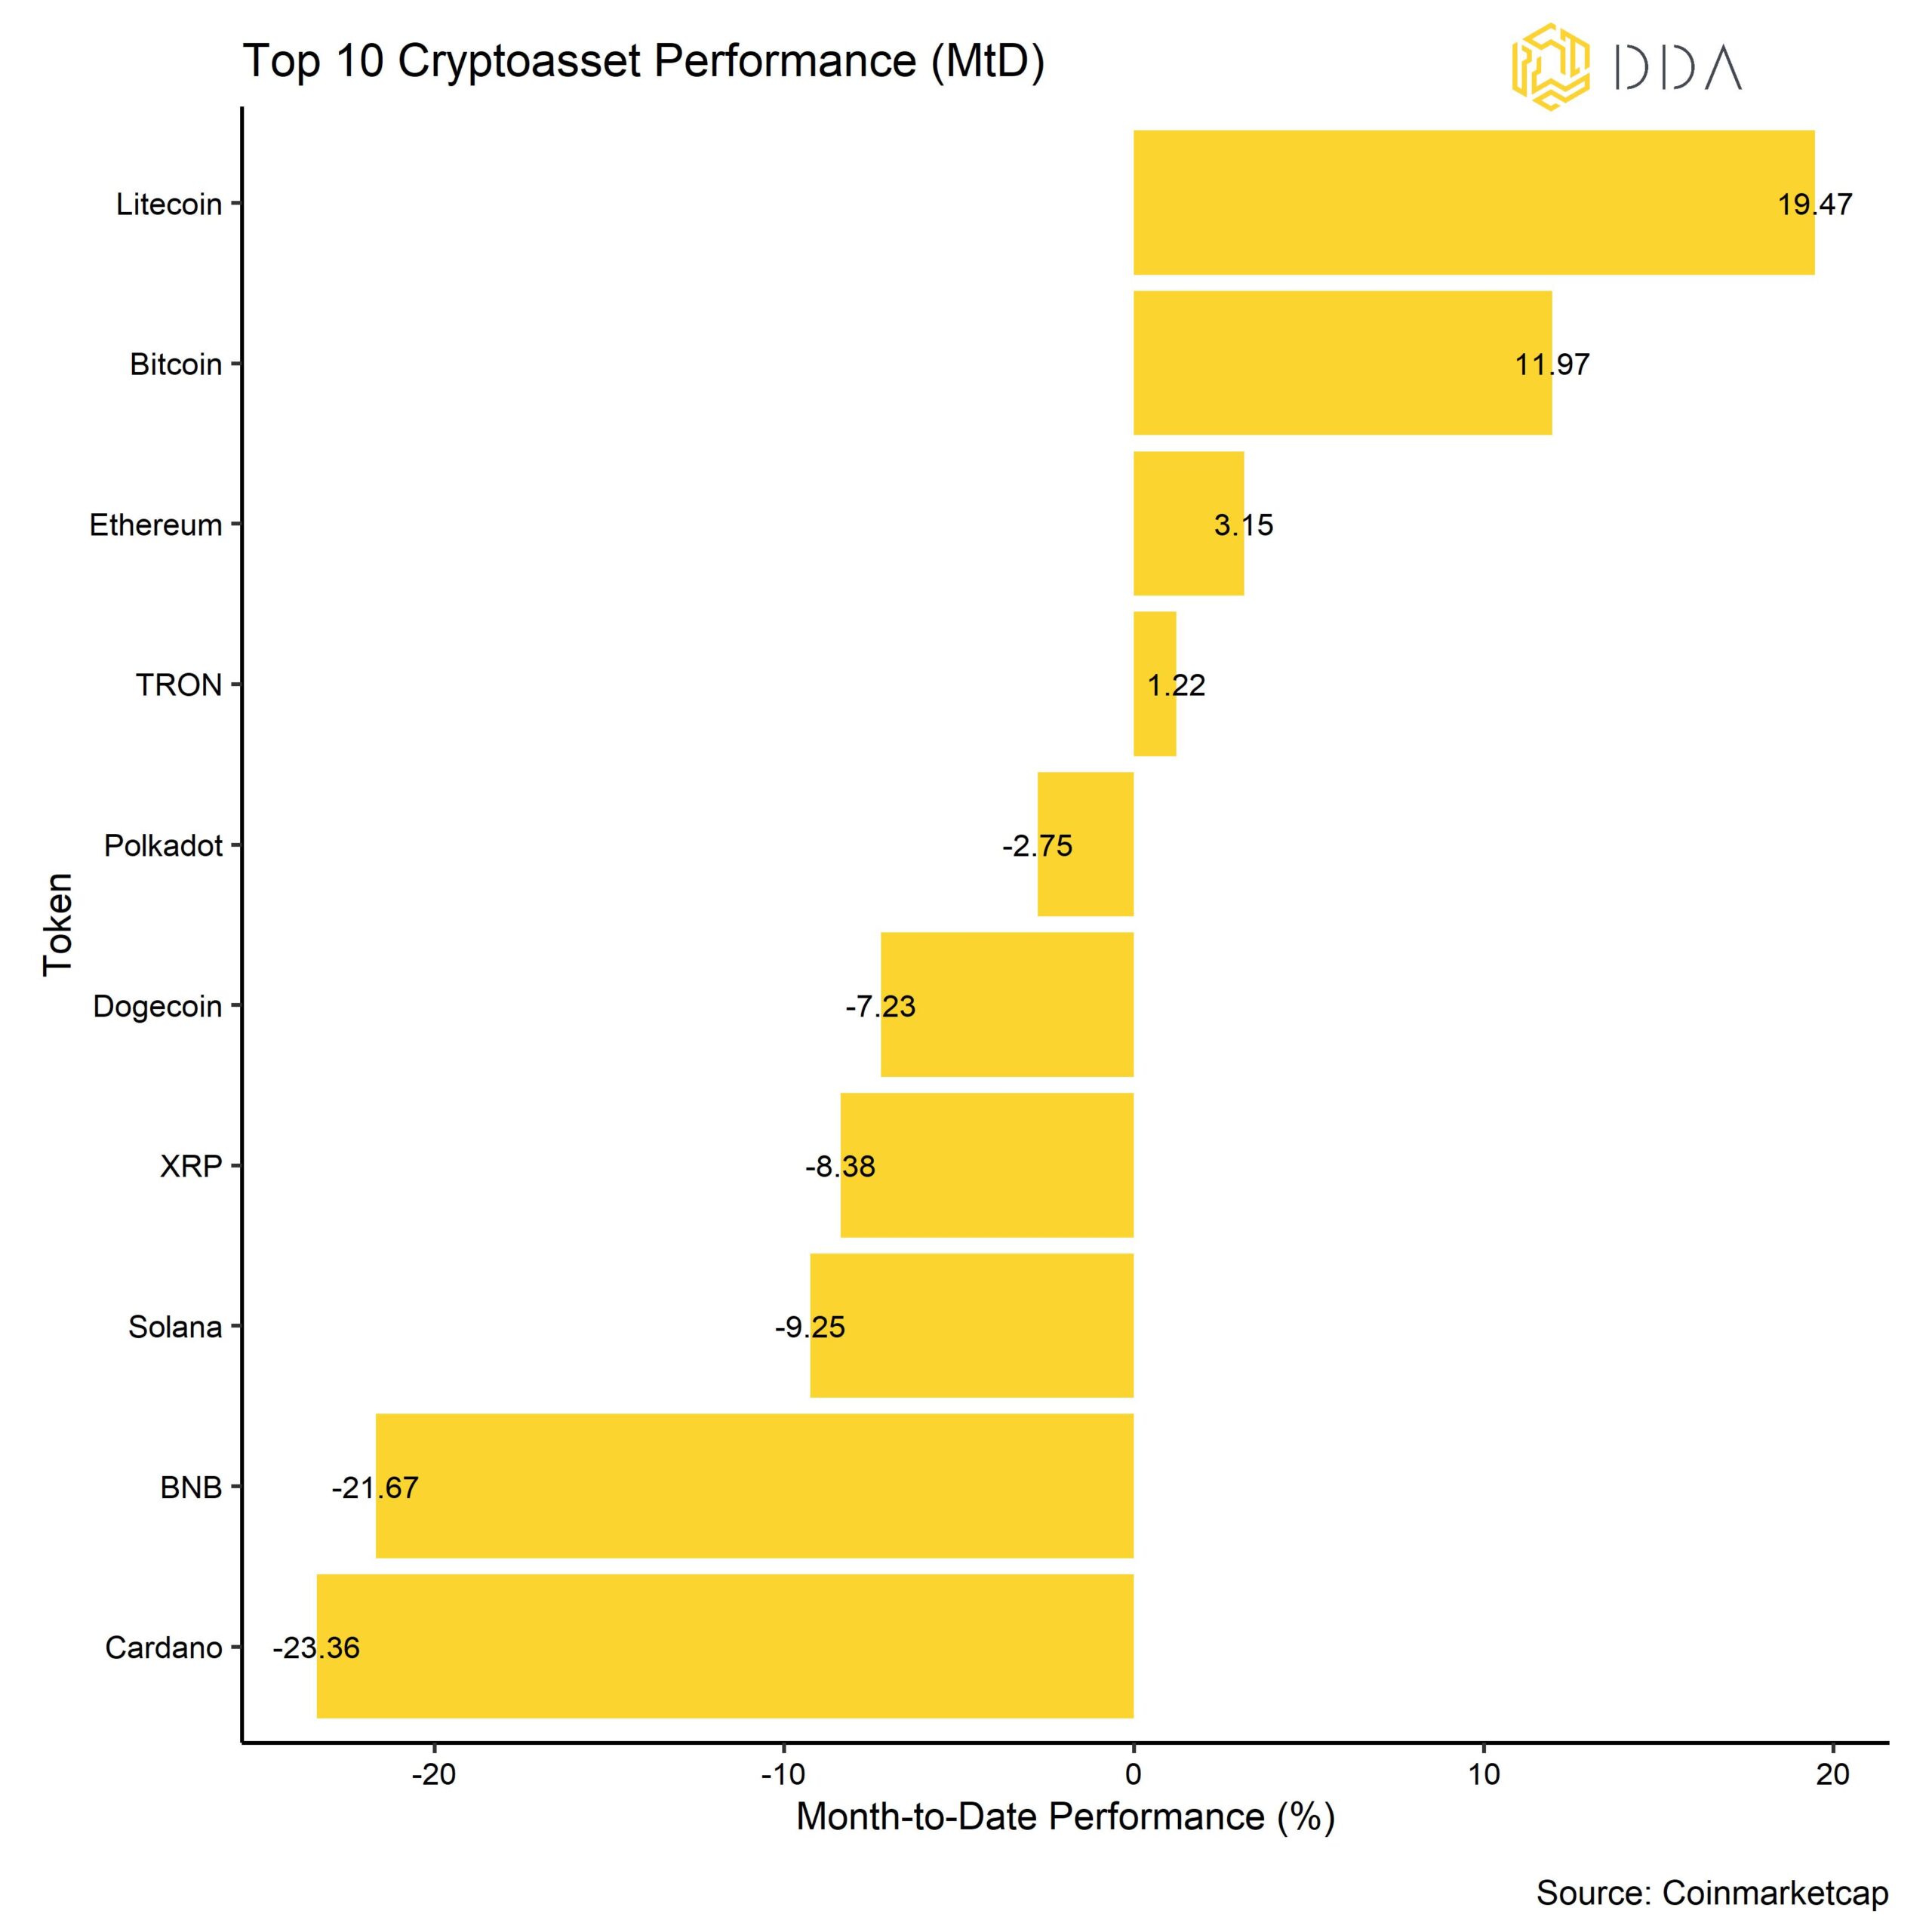
Performance dispersion among cryptoassets continued to pick up significantly during the last month as the SEC charges against Binance US and Coinbase focused on some altcoins while Bitcoin and Ethereum were spared.
An increase in dispersion means that cryptoasset performances are increasingly driven by coin-specific factors in contrast to systematic factors. This was also accompanied by an increase in altcoin outperformance vis-à-vis Bitcoin. In the month of June, only 30% of our tracked altcoins managed to outperform Bitcoin. This was mostly due to the SEC’s charges against Binance US and Coinbase that singled out major altcoins such as Polygon or Solana as potential securities.
In general, among the top 10 major cryptoassets, Litecoin, Bitcoin, and Ethereum have been the main outperformers. Litecoin continued to be buoyed by the upcoming halving expected in August. While both Bitcoin and Ethereum were supported by Blackrock’s Bitcoin Trust filing in the US and strong on-chain fundamentals.
Likewise, our own passive DDA products have performed accordingly in June:
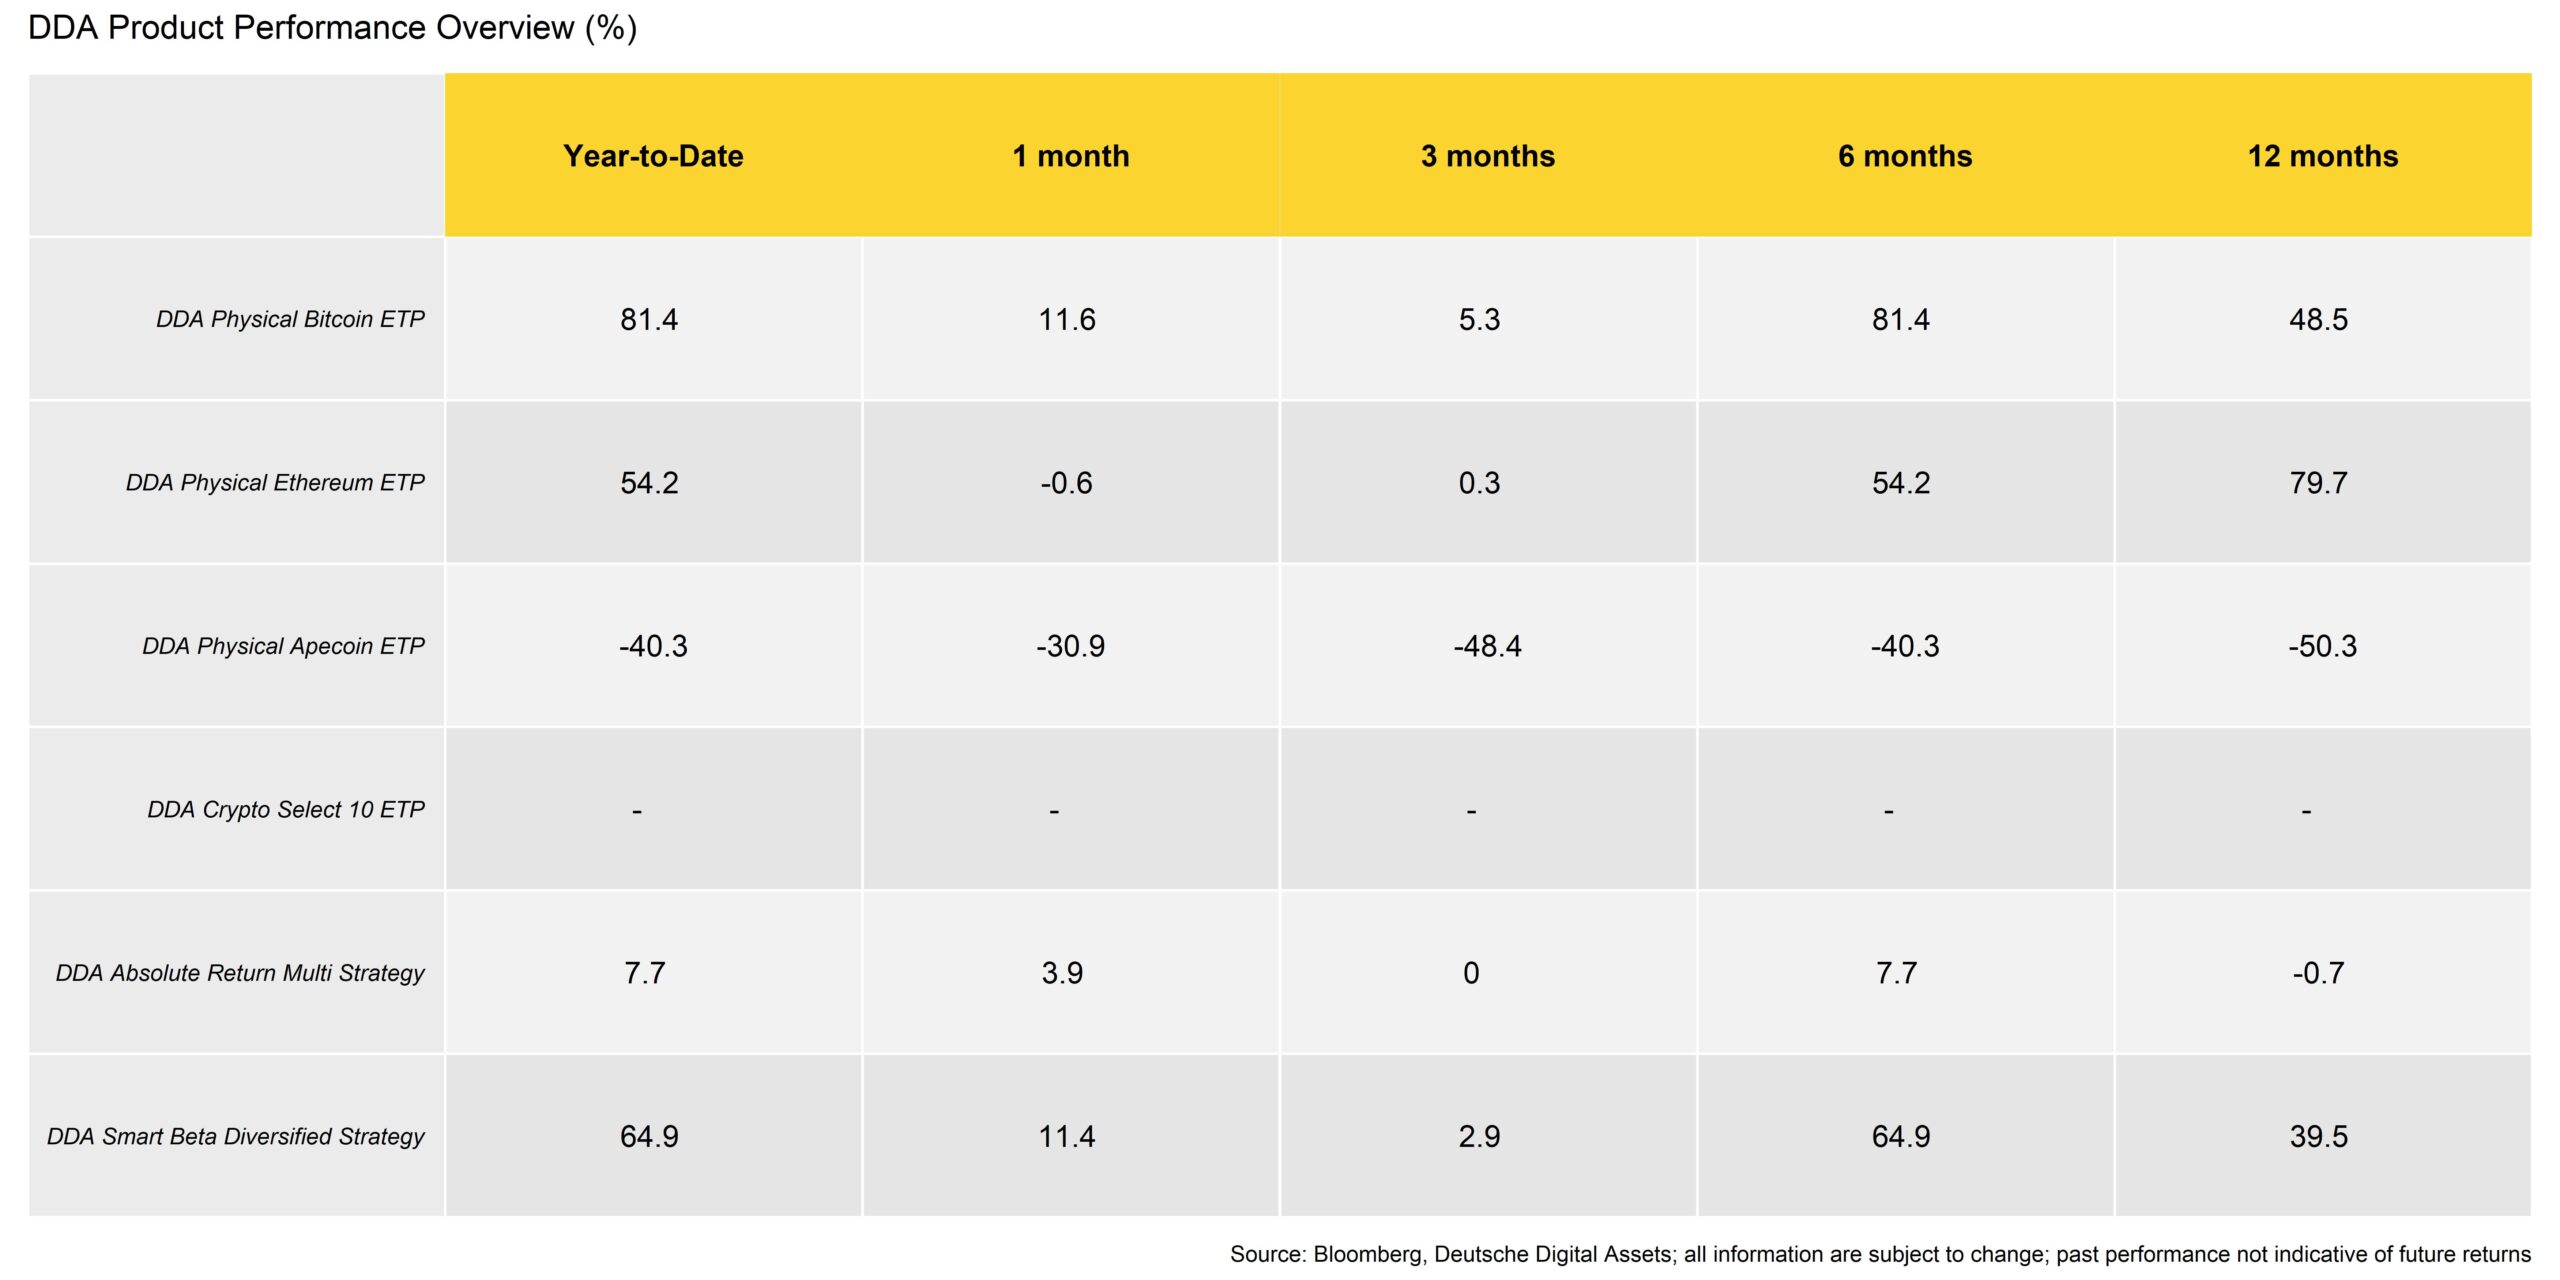
We have recently launched our new DDA Crypto Select 10 ETP (SLCT) that invests into the top 10 cryptoassets based on market cap (subject to exchange listing criteria).
Our absolute return strategies also performed well in June, mainly due to relative value trades and in particular the massive underperformance of BNB. In the beta programme, however, the picture was more mixed, with momentum strategies suffering particularly bad before making a strong comeback at the end of the month.
Traditional financial assets also performed very positively in June as risky assets such as equities and commodities outperformed safer assets such as bonds and gold.
Bottom Line: Cryptoassets posted a very positive performance in June mainly due to Blackrock’s Bitcoin Trust filing in the US that has sparked a new wave of optimism among cryptoasset investors. The SEC’s charges against Coinbase and Binance US have led to an increase in performance dispersion among cryptoassets and to a significant underperformance of altcoins vis-à-vis Bitcoin.
Macro & Markets Commentary
From a macro point of view, US regulatory events, the FOMC monetary policy decision and Blackrock’s Bitcoin trust filing were probably the main catalysts last month.
The SEC’s charges against exchange behemoths Coinbase and Binance had created significant volatility at the beginning of the month. We have covered these events in more detail here.
More specifically, the SEC had filed 13 different charges against Binance and its founder Chenpeng Zhao including operating an unregulated securities exchange, misrepresenting trading controls and oversight on the Binance.US platform, and the unregistered offer and sale of securities. In contrast, the pending Coinbase lawsuit also focuses on the unregistered offer and sale of securities in connection with its staking-as-a-service program.
As a result, many major altcoins that were mentioned in both SEC filings such as Polygon (MATIC), Cardano (ADA) or Solana (SOL) experienced significant selling pressure and there was a general underperformance of altcoins vis-à-vis Bitcoin during June and Bitcoin’s market cap dominance surpassed 50%.
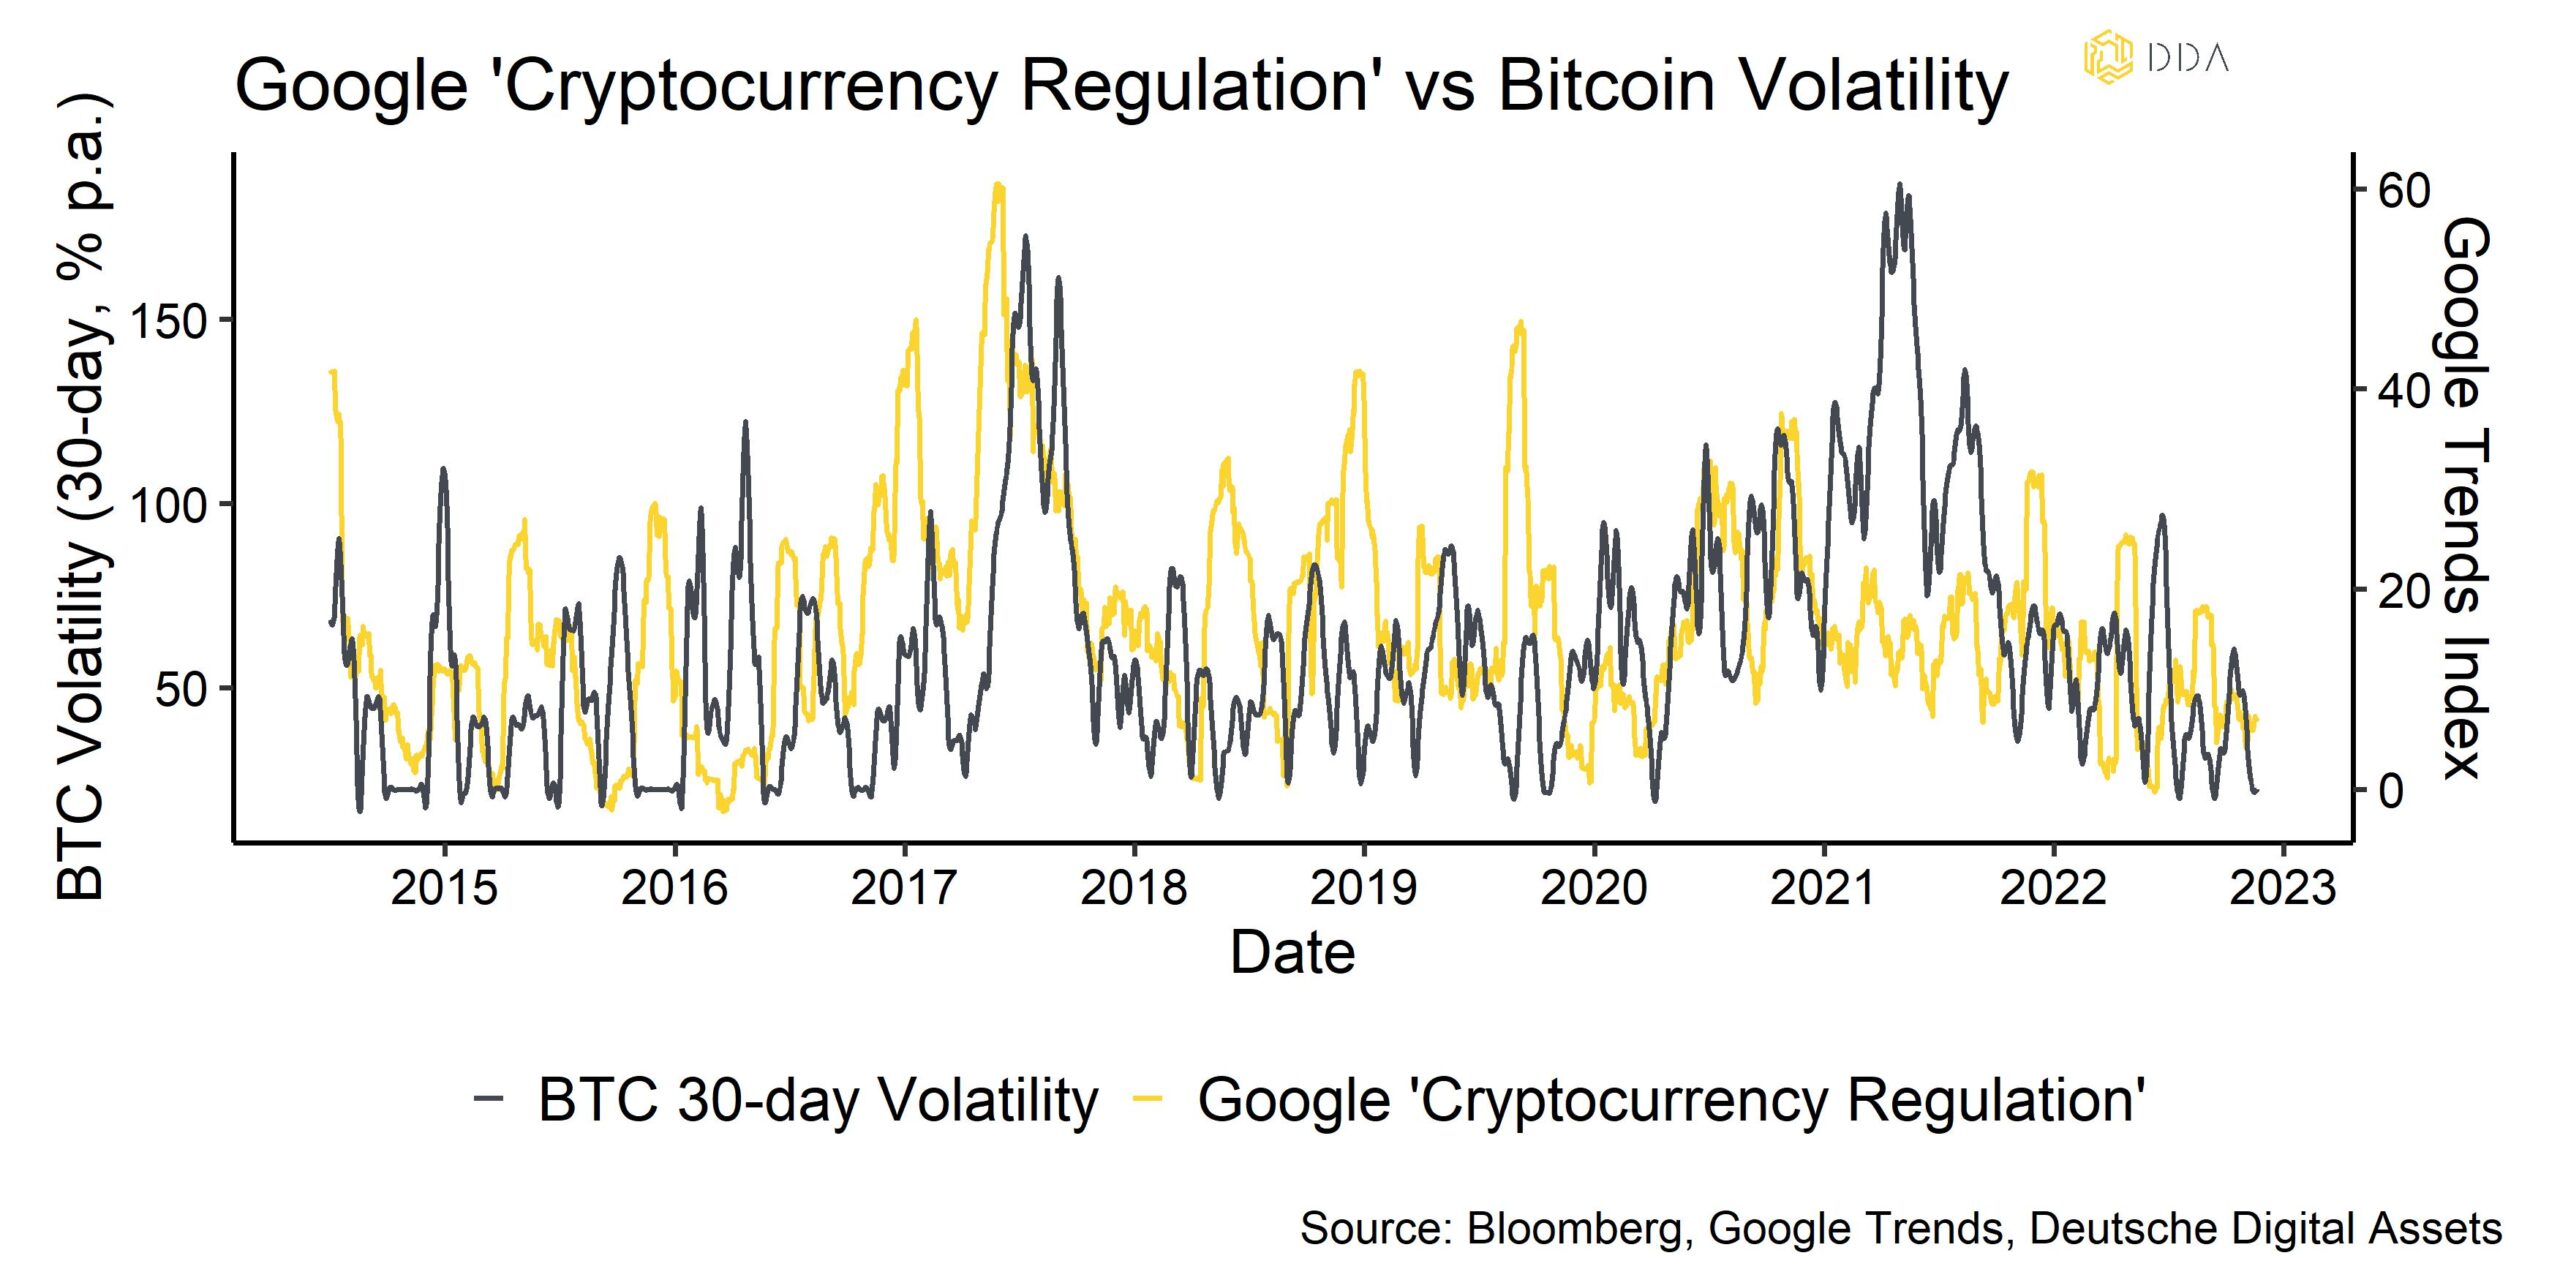
Increasing attention on the topic of “Cryptocurrency Regulation” in the US used to be a source of volatility in Bitcoin in the past, especially during the retail frenzy in 2017/18 but the importance of that appears to have decreased in recent years. Note that the above chart shows US-based Google search queries only.
The good news is that, now that the US regulatory uncertainty appears to be digested by the markets, there is actually less risk coming from this side going forward.
The recent filings of major traditional asset managers such as Blackrock and Invesco could also be related to that significant decline in US regulatory uncertainty.
More specifically, Blackrock’s ETF provider iShares filed a Bitcoin Trust on June 15th which has renewed optimism in the industry and appears to have sparked a new wave of Bitcoin-based ETF filings.
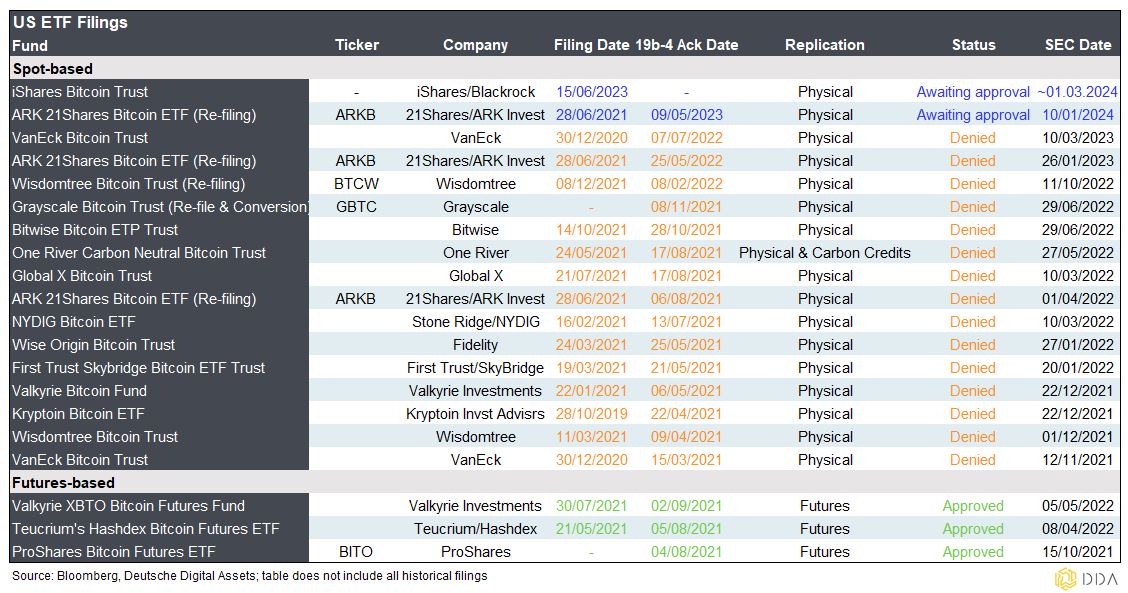
There are already some spot Bitcoin Trusts approved by the SEC in the US but which only trade Over-the-Counter (OTC) and not on exchanges. The biggest Bitcoin Trust by Grayscale (GBTC) also does not offer redemptions of shares which is expected to be enabled in the filed fund by Blackrock. A Bitcoin trust issued by the biggest asset manager in the world is expected to increase cryptoasset adoption rates in the US significantly which, according to the latest estimates by Coinbase, sits at around 36% for institutional investors. Blackrock currently holds around 33% of the ETF market share.
The next big step is the so-called 19b-4 filing, which will formally start the approval-seeking process. This may happen in the next weeks or so. But in the past, the SEC has rejected applications, citing a need for more regulations.
There is still a chance that this could happen to Blackrock’s application as well which still represents a risk for overall market sentiment and which could revert much of the euphoria we have seen lately.
Other spot Bitcoin ETFs have so far been denied by the SEC based on insufficient regulatory clarity (see table).
However, the Bitcoin Trust filing by Blackrock has sparked a new wave of optimism among institutional asset managers and banks who have hurried to move into the crypto asset space.
Consider the following events:
- Deutsche Bank has officially applied for crypto custody license in Germany
- Fidelity, Charles Schwab, and Citadel back new crypto asset exchange EDX Markets (EDX): Products traded on EDX include Bitcoin, Bitcoin Cash, Ethereum and Litecoin
- Other large asset managers have (re-)filed for a spot Bitcoin ETF with the SEC, including Invesco and Wisdomtree within 24 hours of Blackrock’s filing.
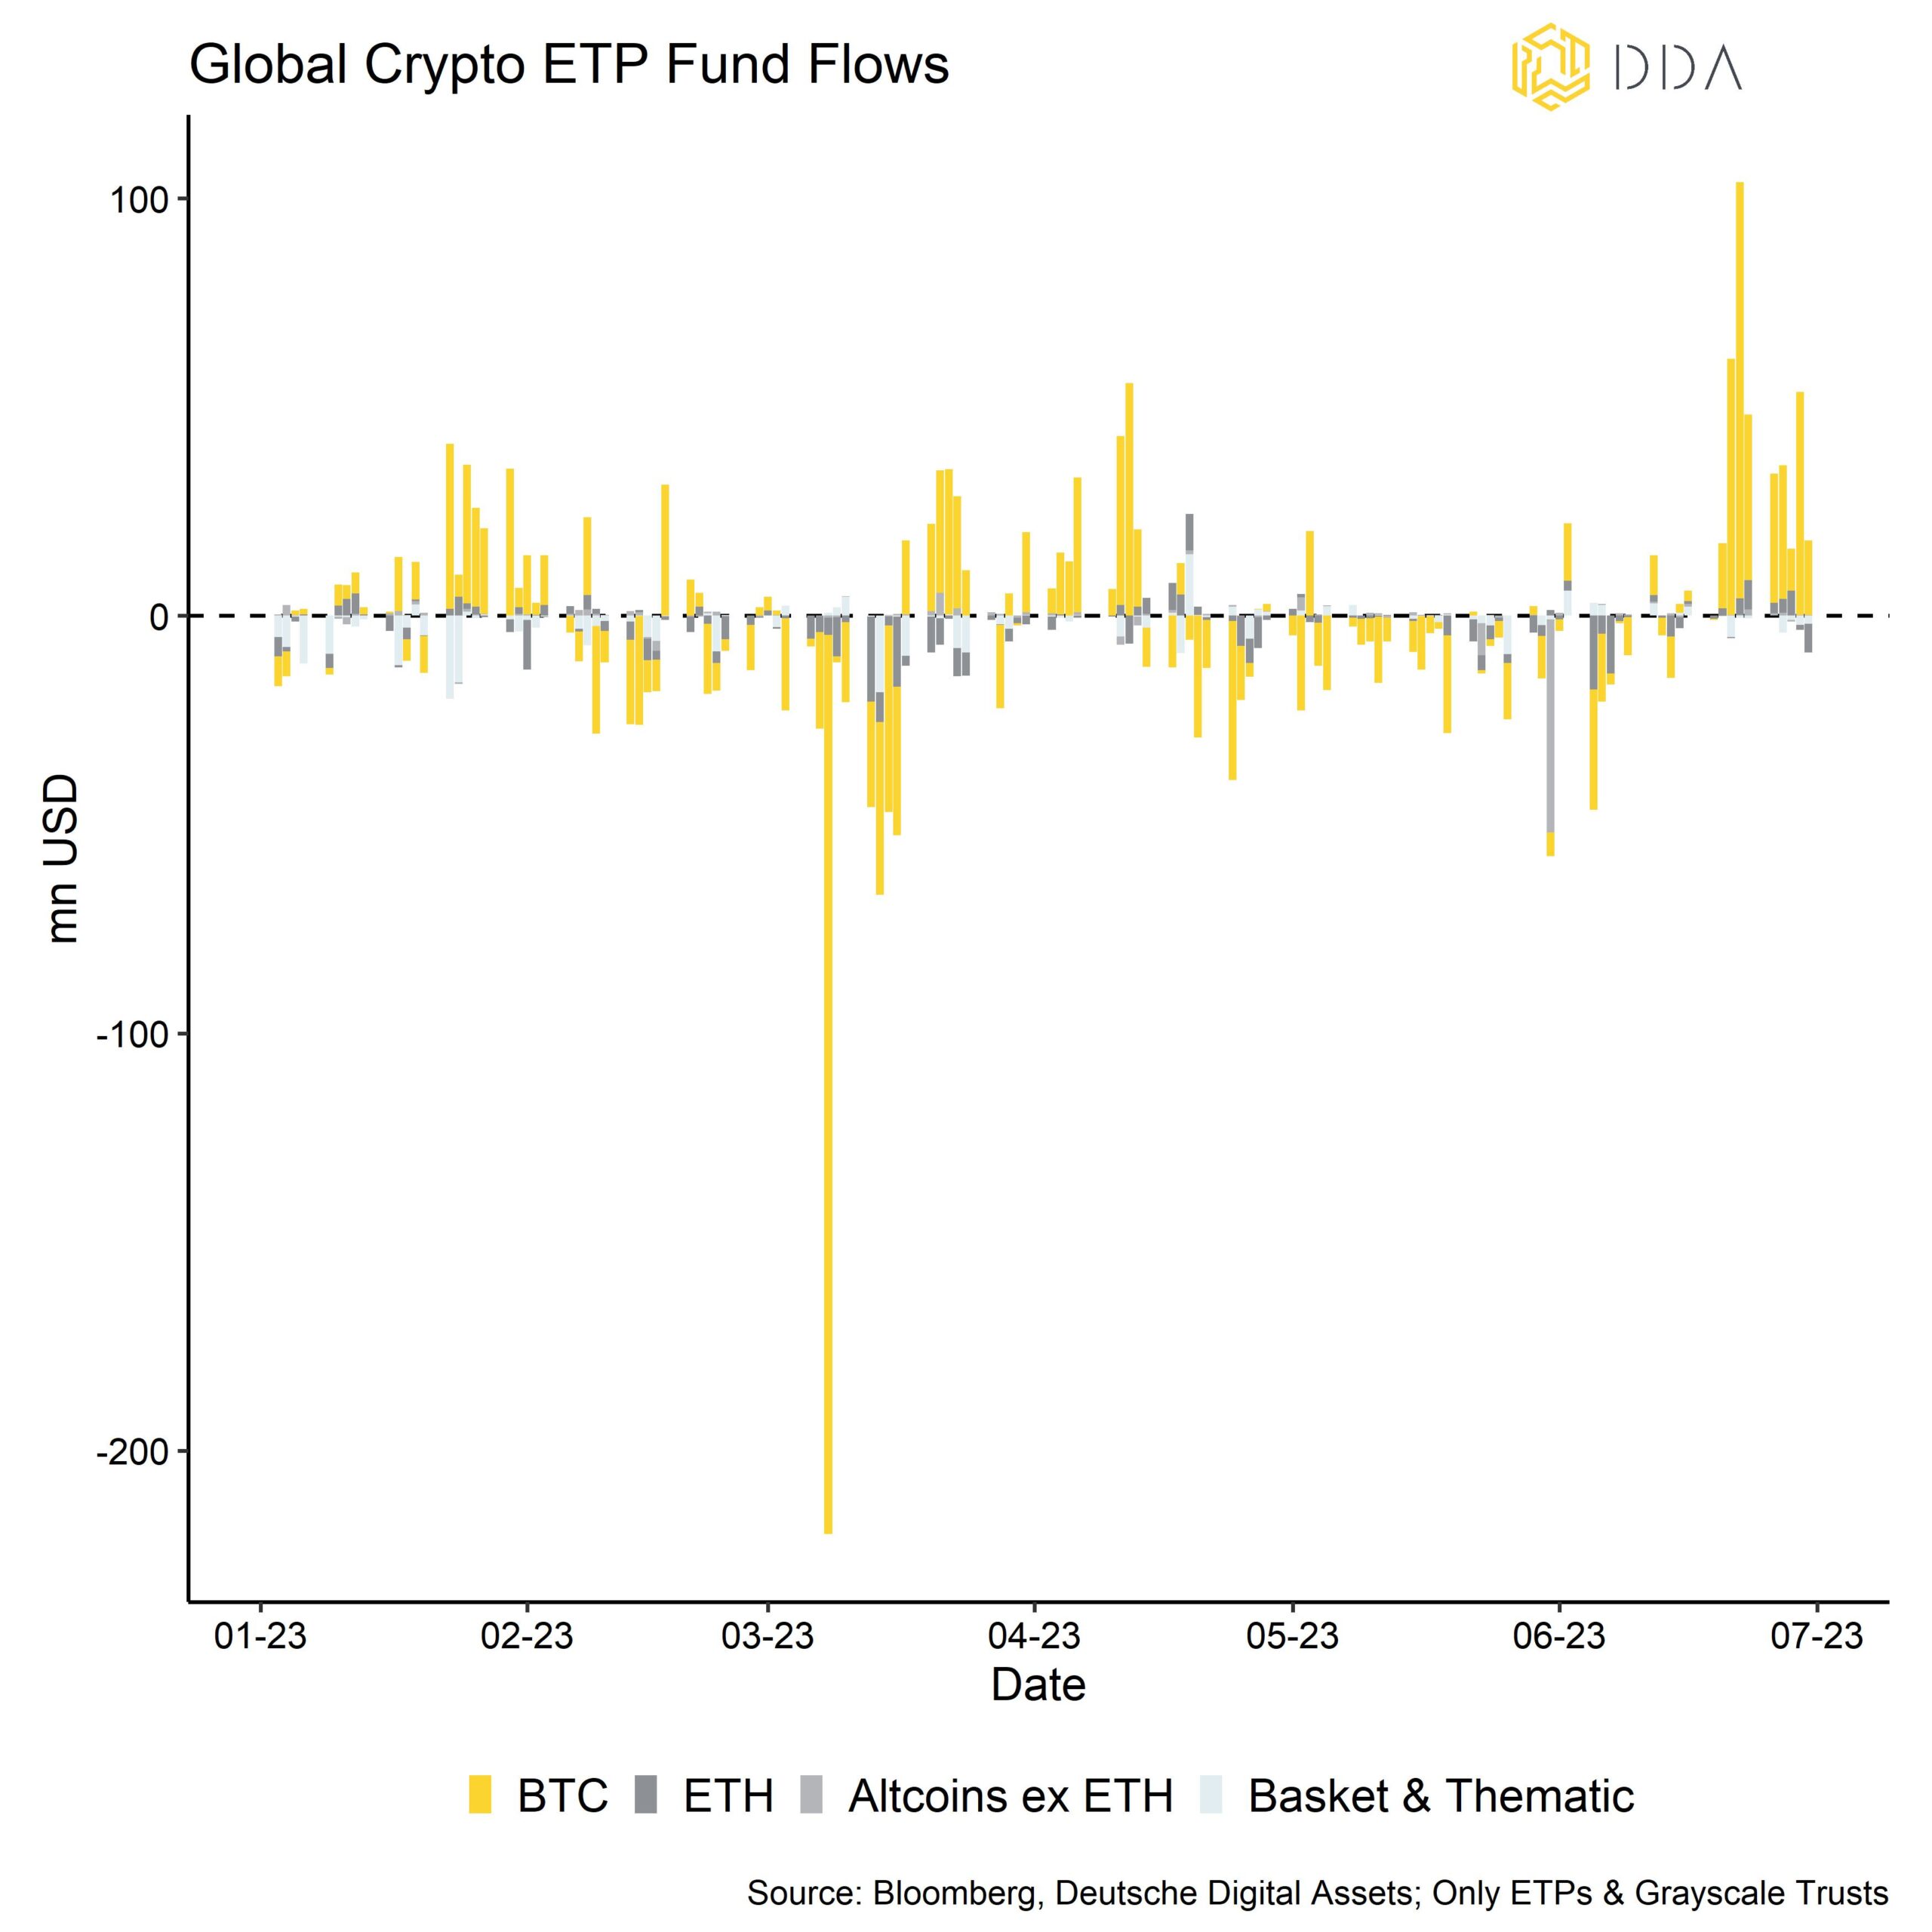
As a result, these events have sparked the highest amount of weekly fund inflows into cryptoassets year-to-date which have reached +203.7 mn USD the week after Blackrock filed for its Bitcoin ETF in the US. The latest weekly net flows into crypto assets amount to another +140.1 mn USD of which Bitcoin accounted for +144.4 mn USD in net fund flows.
The large majority of these fund inflows were concentrated on Bitcoin.
What has rather gone unnoticed compared to Blackrock’s ETF filing was the latest FOMC monetary policy decisions.
In June, the Fed paused hiking rates for the first time in the entire rate hiking cycle. Pauses are usually the predecessor to an eventual rate easing cycle.
In fact, the inversion of the US yield curve has already signaled an increased risk of a recession due to tight monetary policy and low liquidity growth. Historically speaking, the steepness of the yield curve has been a real-time indicator for liquidity growth.
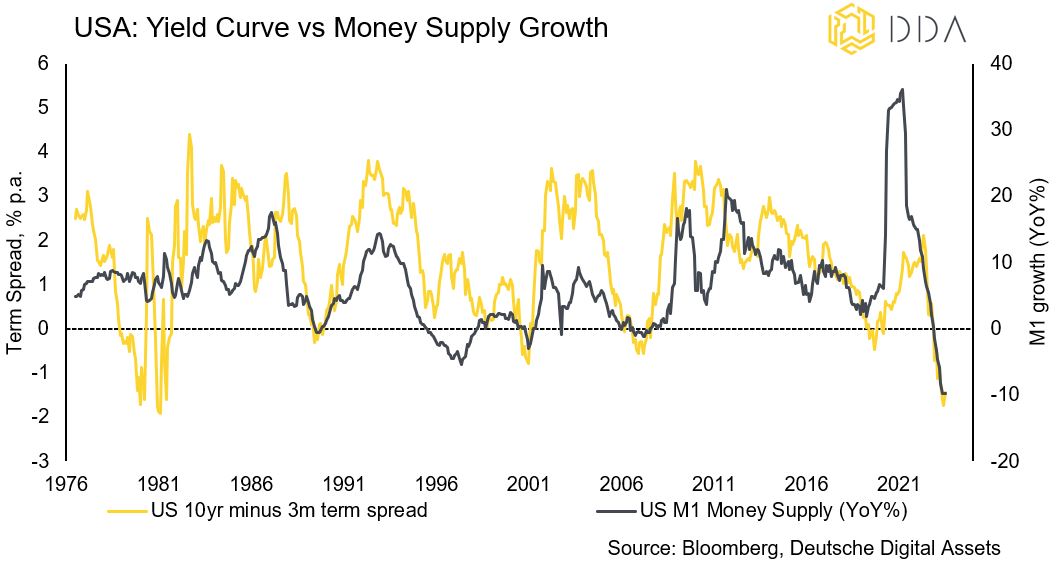
Therefore, an inversion of the yield curve is currently signaling that liquidity is already contracting. More specifically, M1 money supply growth in the US has decreased -9.8% YoY in April 2023 which is the strongest contraction since at least the 1970s. Hence, it is no surprise that the yield curve is so deeply inverted.
In this context, the latest liquidity issues with regional banks in the US have not really resolved. The Bank Term Funding Program (BTFP) by the Fed has partially eased the liquidity problem but not the equity problem at commercial banks.
In fact, the latest usage of the Fed’s BTFP emergency loan facility reached a new all-time high of 103.1 bn USD. In other words, commercial banks traded in 103.1 bn USD in distressed/under-water assets for an aggregate face value of 103.1 bn USD in reserves/liquidity at the Fed.
Major bank’s Credit Default Swaps (CDS) have generally come down since SVB’s collapse in March but still remain well above the lows seen before that crisis. The same is true for interbank liquidity gauges such as the FRA-OIS Spread.
Looking at past yield curve inversions in the US since the 1970s, monetary policy easing cycles, i.e. cuts of the Fed Funds Rate, on average happened 7 months after the inversion of the 10-year minus 3-months US Treasury term spread:
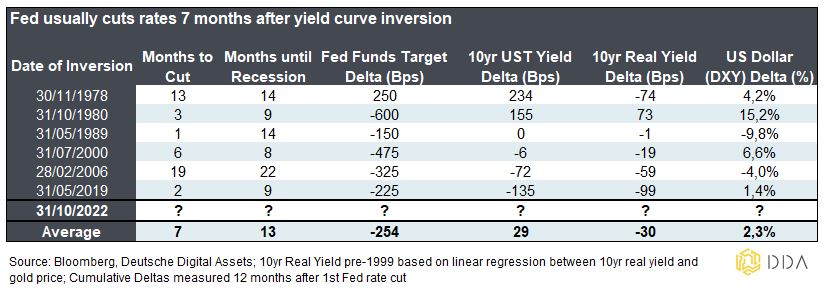
Within 12 months of the first rate cut, there has been an average decline of -250 bps in the Fed Funds Target Rate, a slight increase in 10-year nominal yields (+29 bps), slight reduction in 10-year real yields (-30 bps) and an appreciation of the US Dollar (+2.3%). Usually there is also a significant steepening of the yield curve associated with Fed rate cuts as the short end decreases significantly more than the long end (so-called “bear flattening”).
Based on these averages, you would have expected an initial Fed rate cut in May 2023 already and the start of the US recession in November 2023. So, the Fed already appears to be “behind the curve” and already in over-tightening mode which could possibly lead to a more severe recession down the road.
That being said, Bitcoin returned -44% during the 12 months of the last Fed rate cut cycle that lasted between July 2019 and March 2020.
This could be associated with the fact that the US Dollar appreciated as there was a general Dollar shortage, especially during the Covid-crisis in March 2020.
However, we still expect a US recession and Fed rate cutting cycle to be net bullish for Bitcoin and cryptoassets for the following reasons:
- Based on our in-house macro factor sensitivities, monetary policy appears to be the dominant macro factor, not the US Dollar; this is also shown in the chart below
- Changes in our monetary policy macro factor historically correlate well with changes in real yields
- Fed rate cutting cycles on average have led to reductions of the real yield in the past
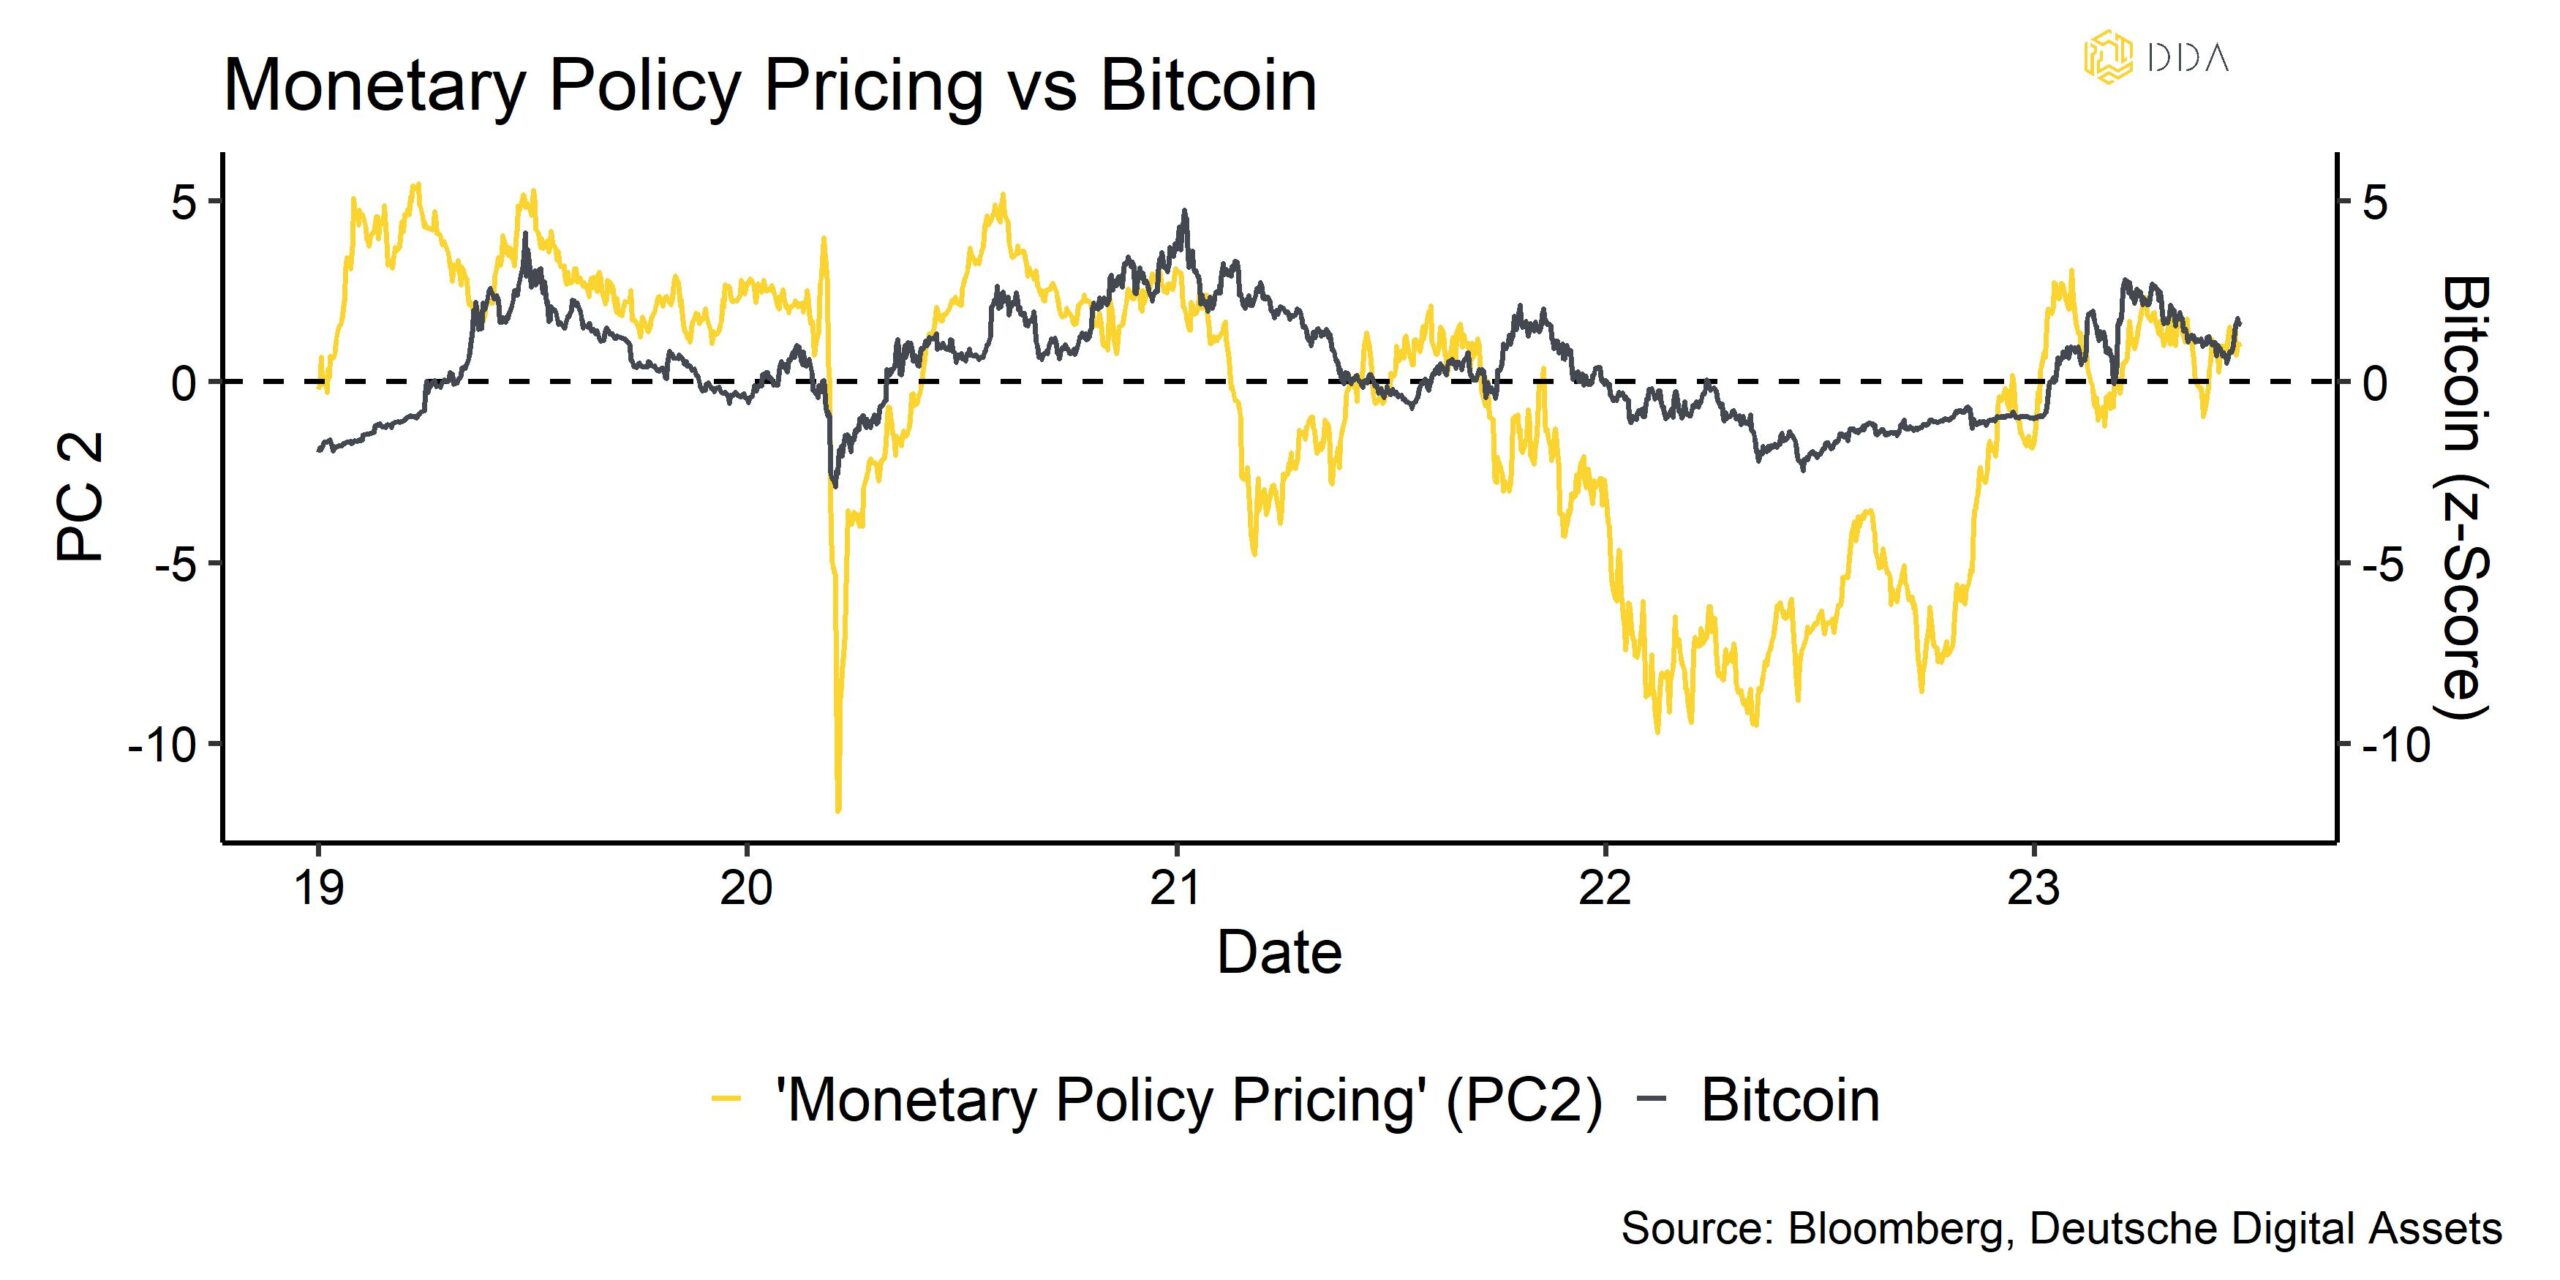
A significant decrease in real yields, i.e. a significant easing in monetary policy, could provide the next significant upleg for Bitcoin from a macro point of view.
It is quite likely that an announcement of an easing cycle would lead to an increase in inflation expectation with a simultaneous decrease in nominal yields due to decreasing Fed rate expectations.
In fact, monetary policy easing announcements (QE1, QE2, Operation Twist, etc) have always led to a significant increase in US inflation expectations in the past. We expect this historical pattern to repeat in the next easing cycle.
Speaking of liquidity, the good news is that net liquidity as measured by bank reserves at the Fed has not contracted significantly despite the much-anticipated re-fill of the Treasury General Account (TGA) at the Fed. All else equal, increases in the TGA reduce liquidity and absorb funds.
So far, there has been an increase of +341 bn USD in the TGA since the beginning of June 2023. Much of that increase appears to have come from a reduction in reverse repos that offset large parts of this increase in TGA. In fact, reverse repos at the Fed have declined by -220 bn USD in the same period. At the moment, bond investors have an economic incentive to substitute funds tied in reverse repos with T-bills that currently have a higher yield.
Bottom Line: A reduction in US regulatory uncertainty should yield less volatility down the road. The Bitcoin Trust filing by Blackrock has sparked a new wave of optimism among institutional asset managers and banks who have hurried to move into the crypto asset space. However, a final SEC approval still appears to be a long shot. Real-time indicators for US liquidity growth such as the yield curve are signaling that liquidity is contracting rapidly. The Fed historically cut rates on average 7 months after the inversion of the yield curve. A new monetary policy easing cycle should be net bullish for Bitcoin and crypto assets.
On-Chain Analytics
Before the recent “Blackrock-induced” price increase, the price of bitcoin for short-term investors fell below cost-basis (26.4k USD) for a short period of time, and we observed some degree of capitulation on the part of this investor cohort in the form of an increase in realized profits on-chain. Apparently, short-term investors panicked and wanted to save some of their unrealized profits in anticipation of further downside.
Therefore, a short-term “seller exhaustion” factor contributed to a subsequent price increase. For instance, this is evident in the dip of the short-term holder net unrealized profit/loss (STH-NUPL) metric below 0 and subsequent increase in short-term holder (STH) realized profits.
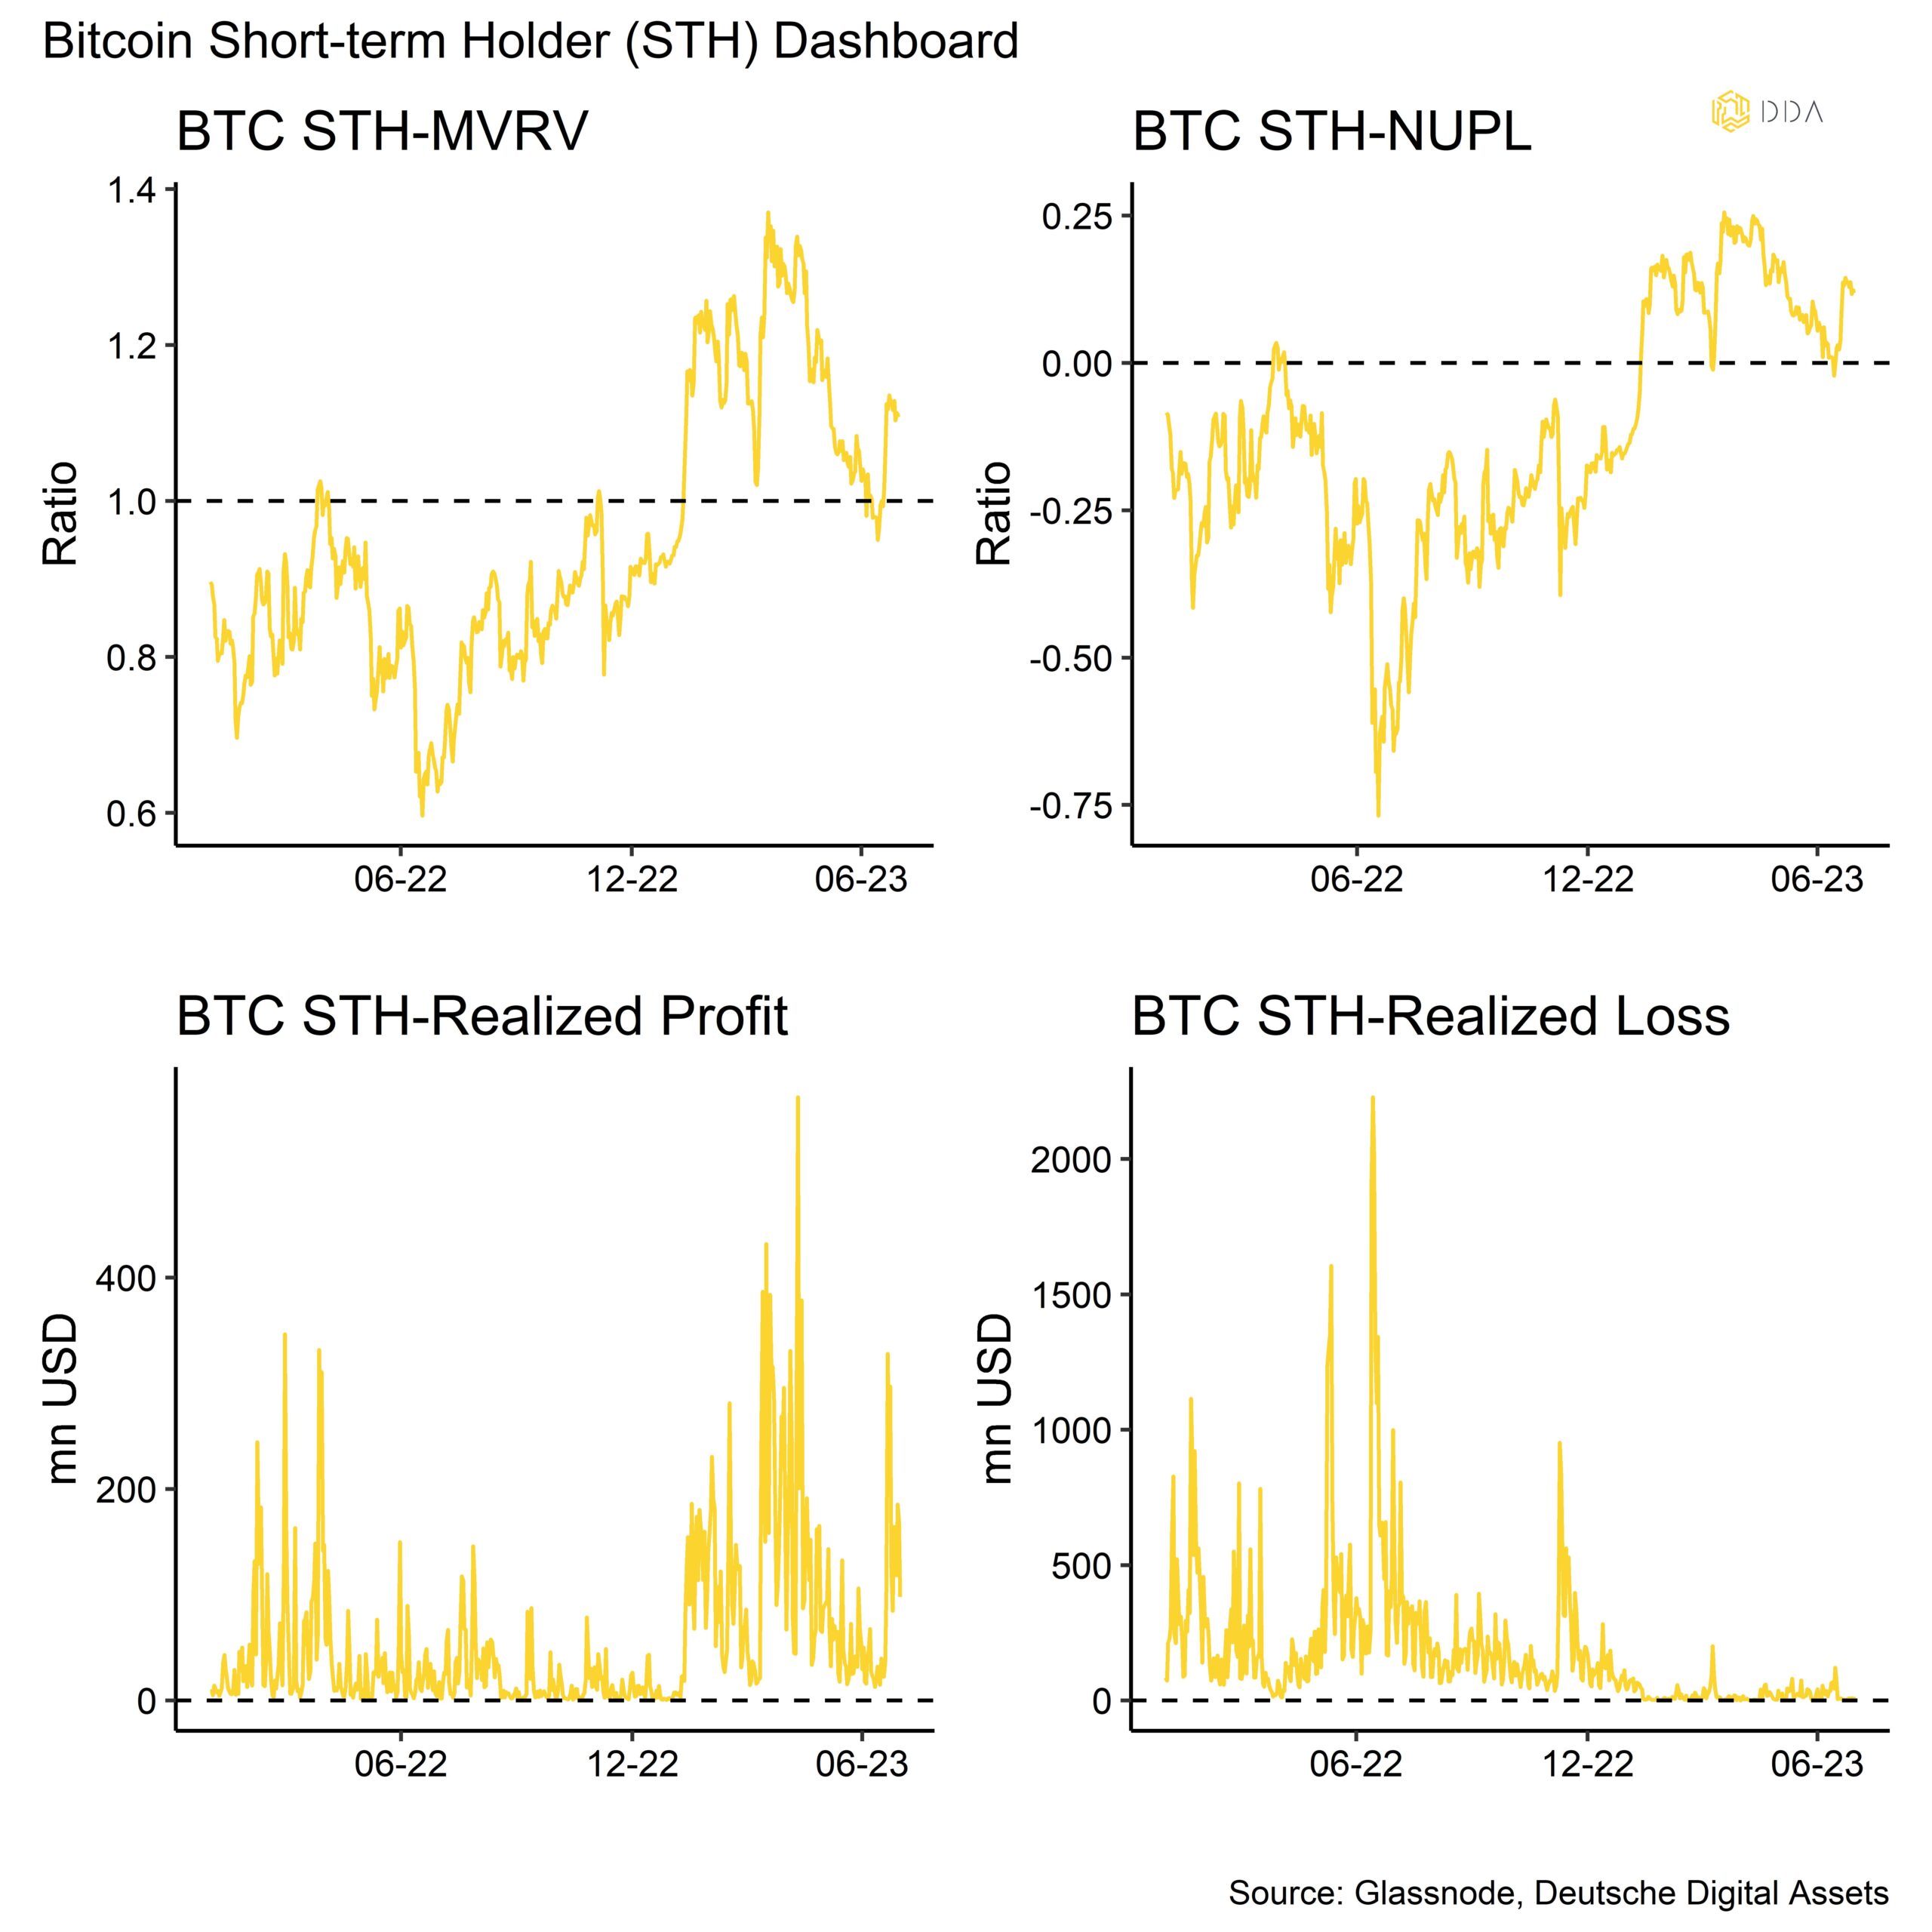
Short-term holders are typically viewed as “weak hands” with a higher likelihood of distribution when prices decrease from the view of a pure investor.
This year, short-term holders have generally been quite active in taking profits. As these investors have a holding period of max 155 days or less, taking profits means that these investors are already exiting positions entered at the beginning of the year in January 2023 or later during the latest upswing in prices.
In contrast, long-term holders (LTH) which are usually considered to be “strong hands” from a pure investment point of view have been very reluctant to sell their holdings this year.
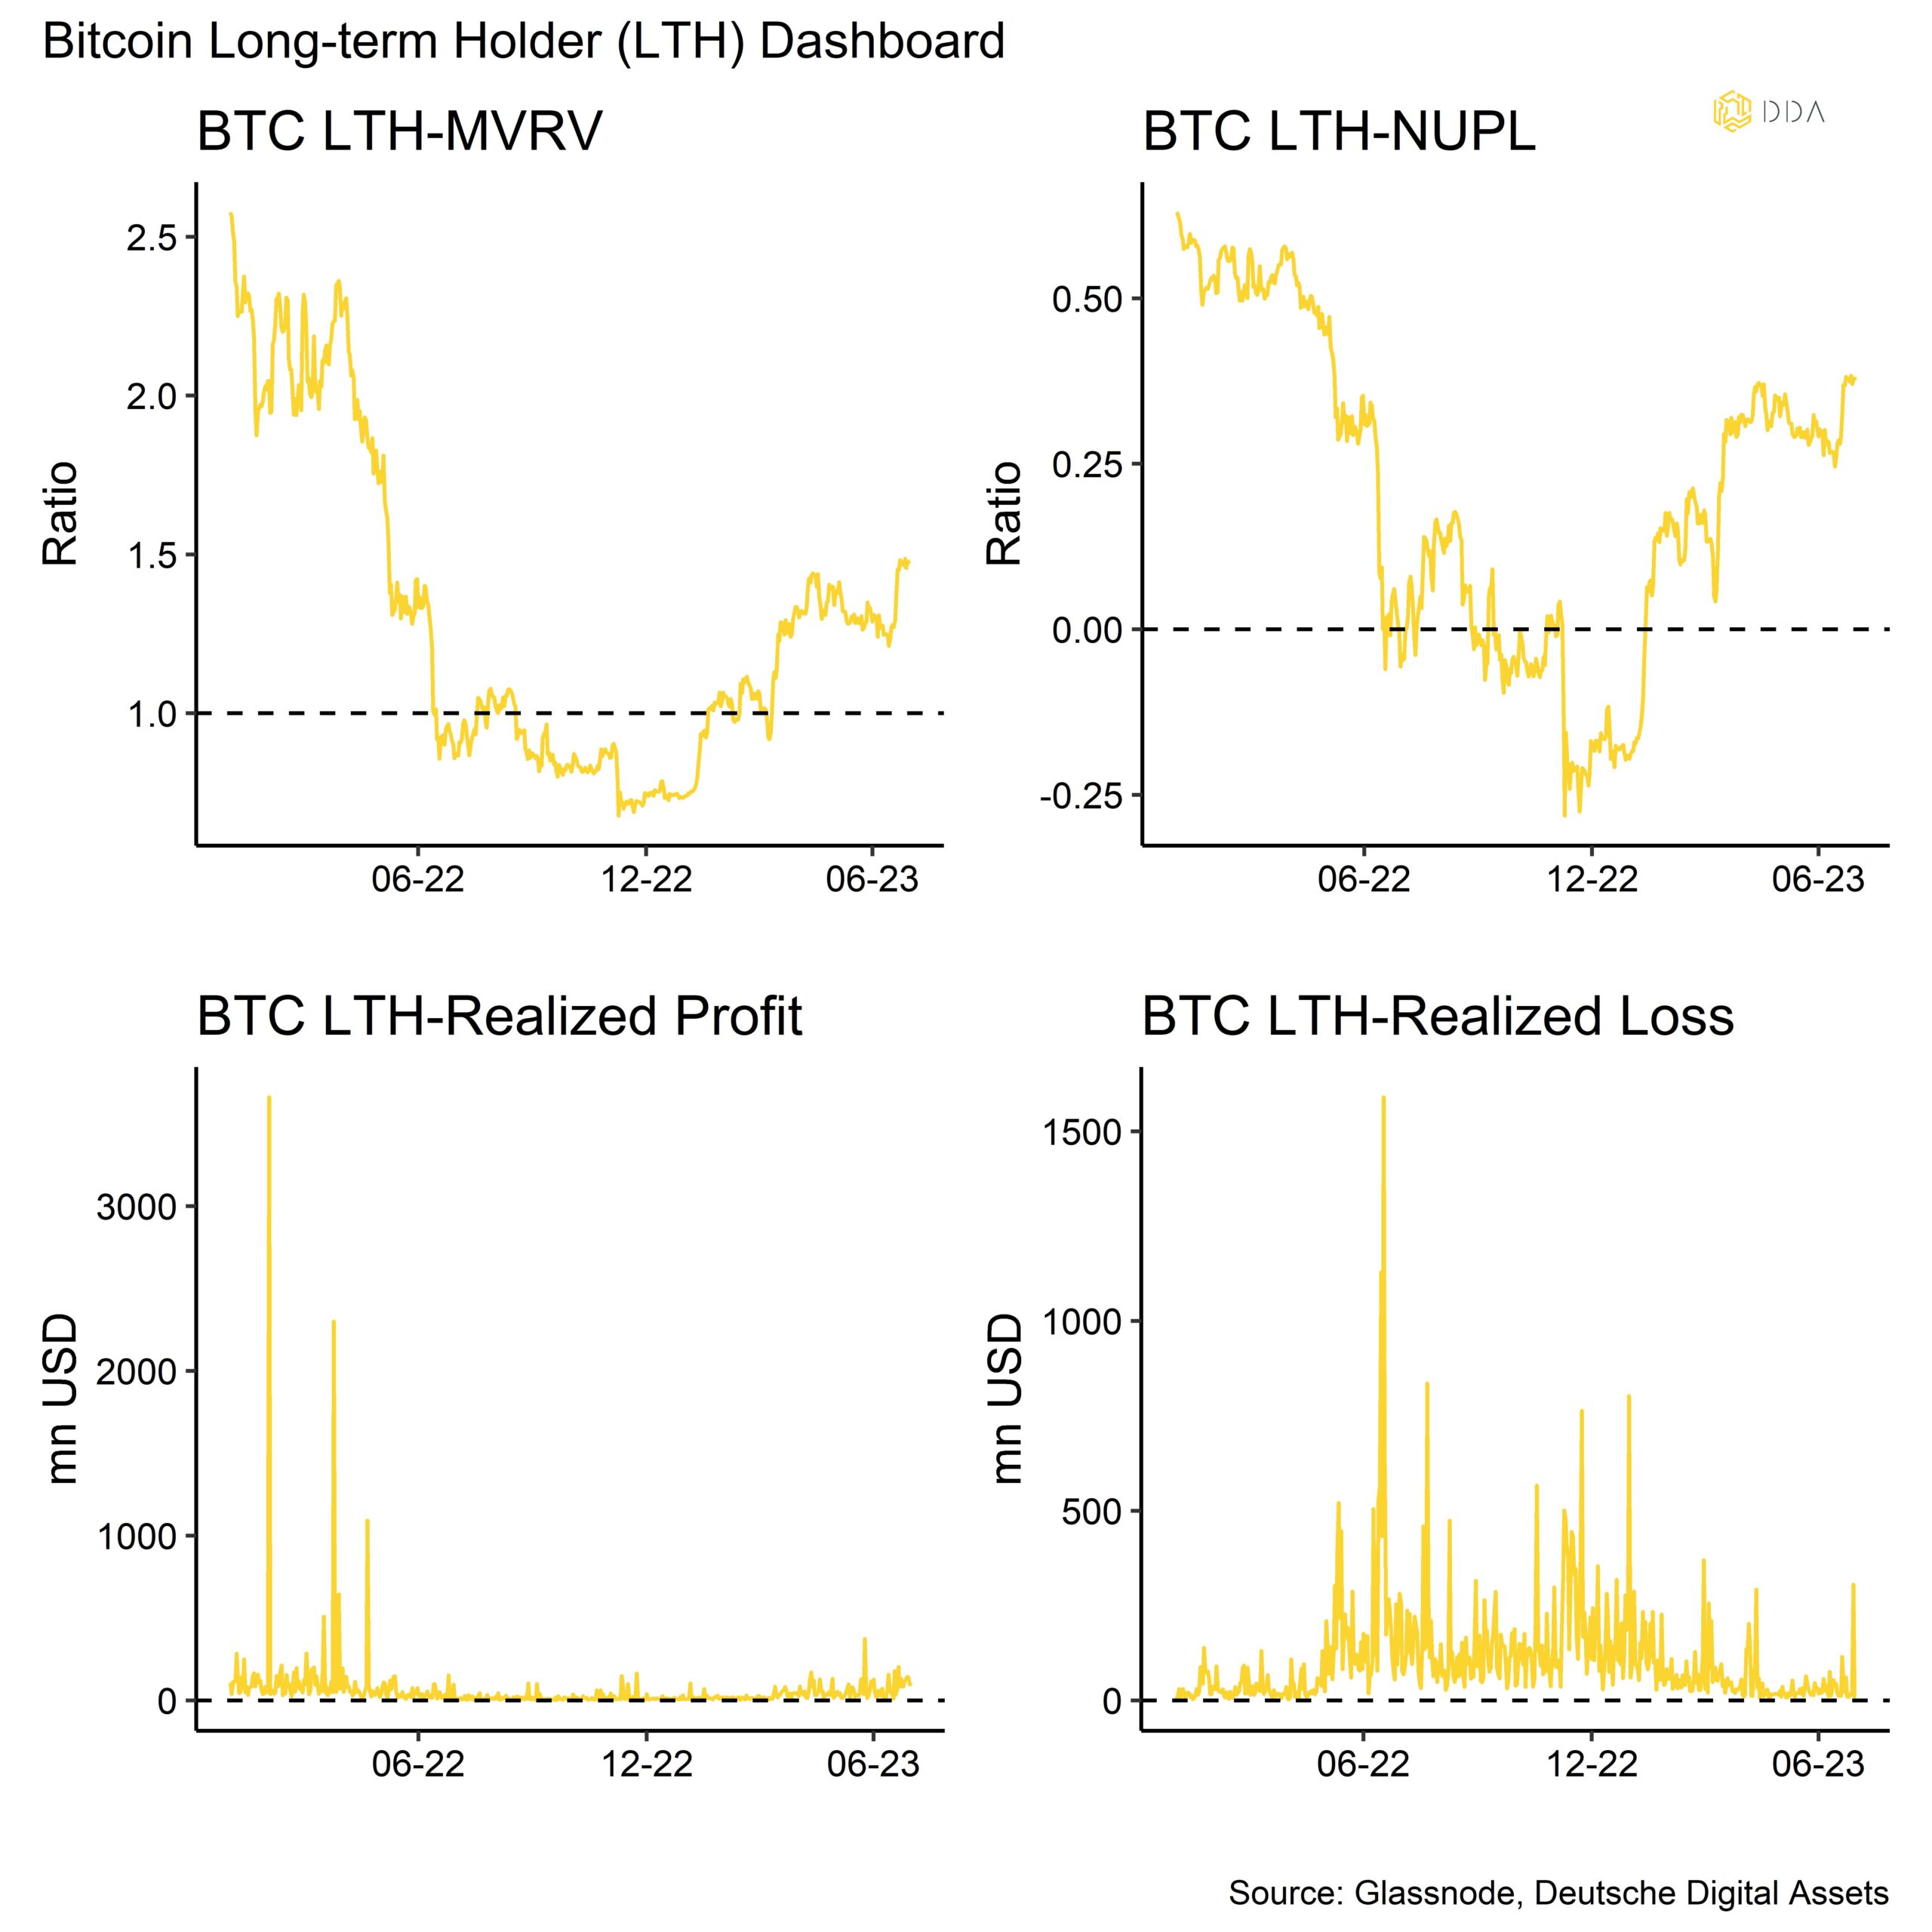
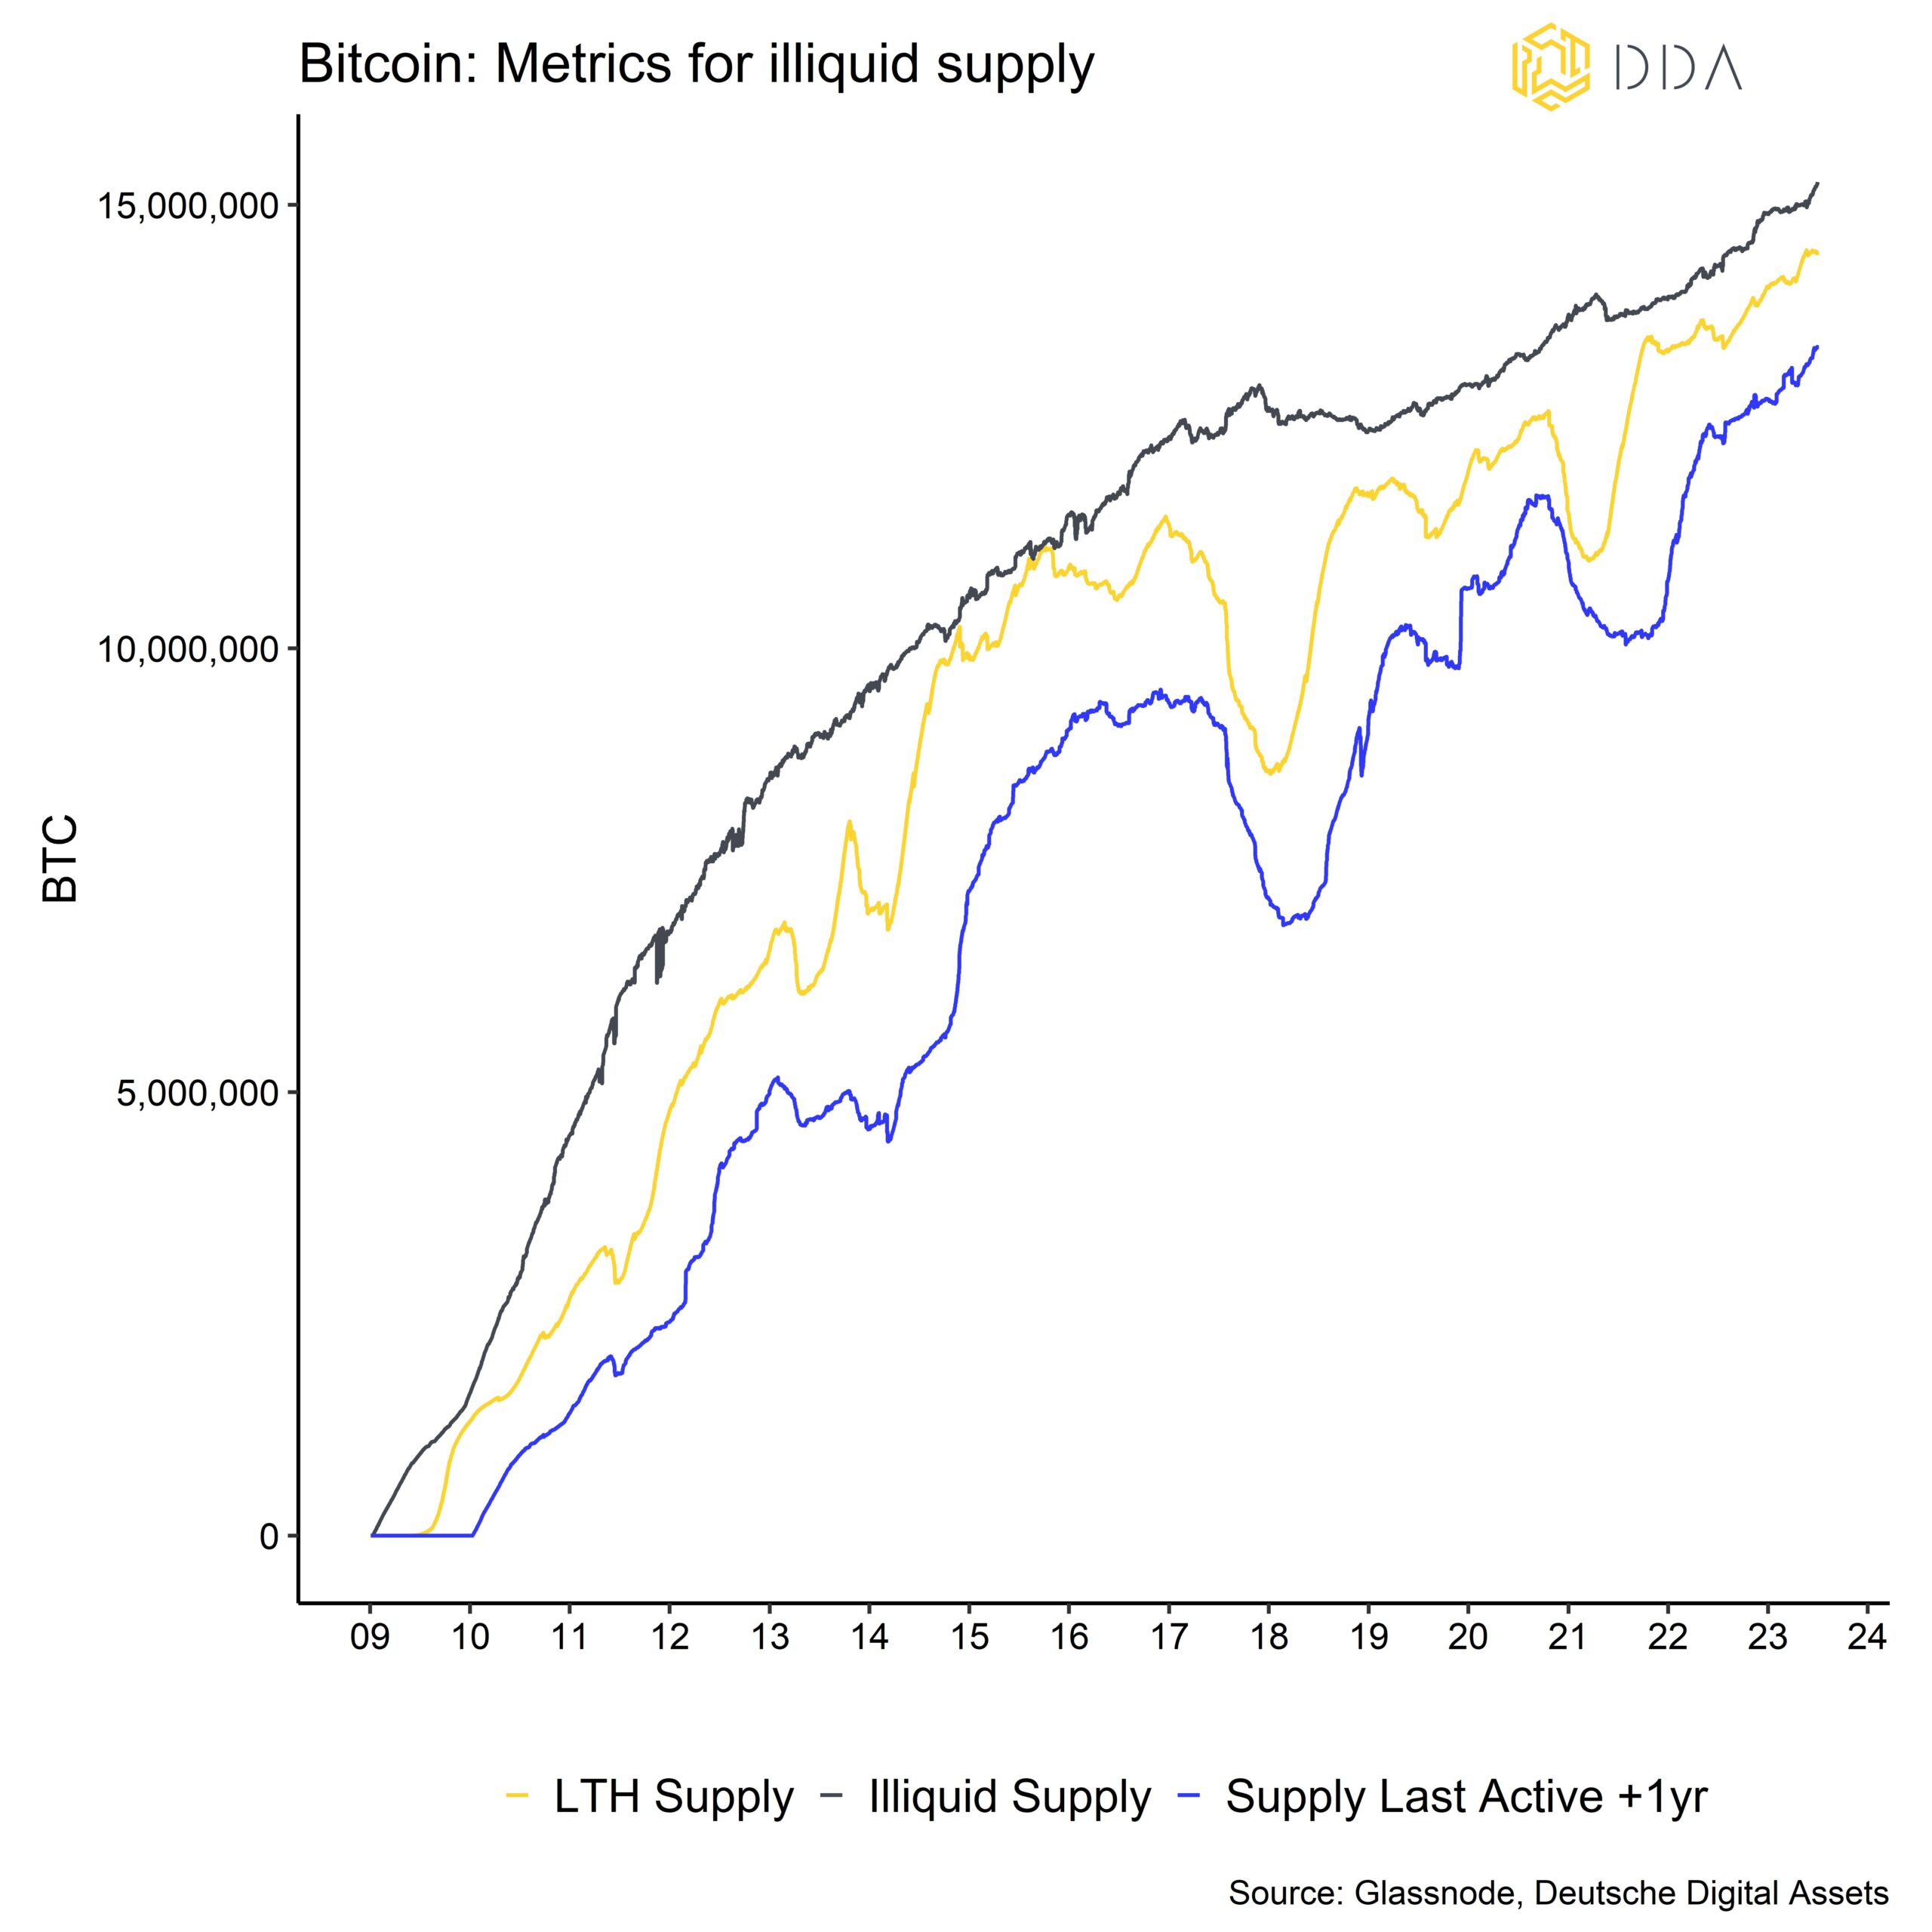
Neither realized profits nor losses have increased significantly this year. It should be emphasized that long-term holders are the more significant investor cohort. At the time of writing, long-term holders are holding around 14.47 mn BTC which represents around 74.5% of total circulating supply according to data provided by Glassnode.
In fact, the bitcoin supply is becoming increasingly illiquid. LTH supply has been outgrowing circulating supply since February 2021 with +2.4% YoY versus +1.7% YoY at the time of writing. According to the latest data by Glassnode, approximately 15.2 mn coins are deemed “illiquid” – a new all-time high. Around 70% of supply has not moved at least 1 year.
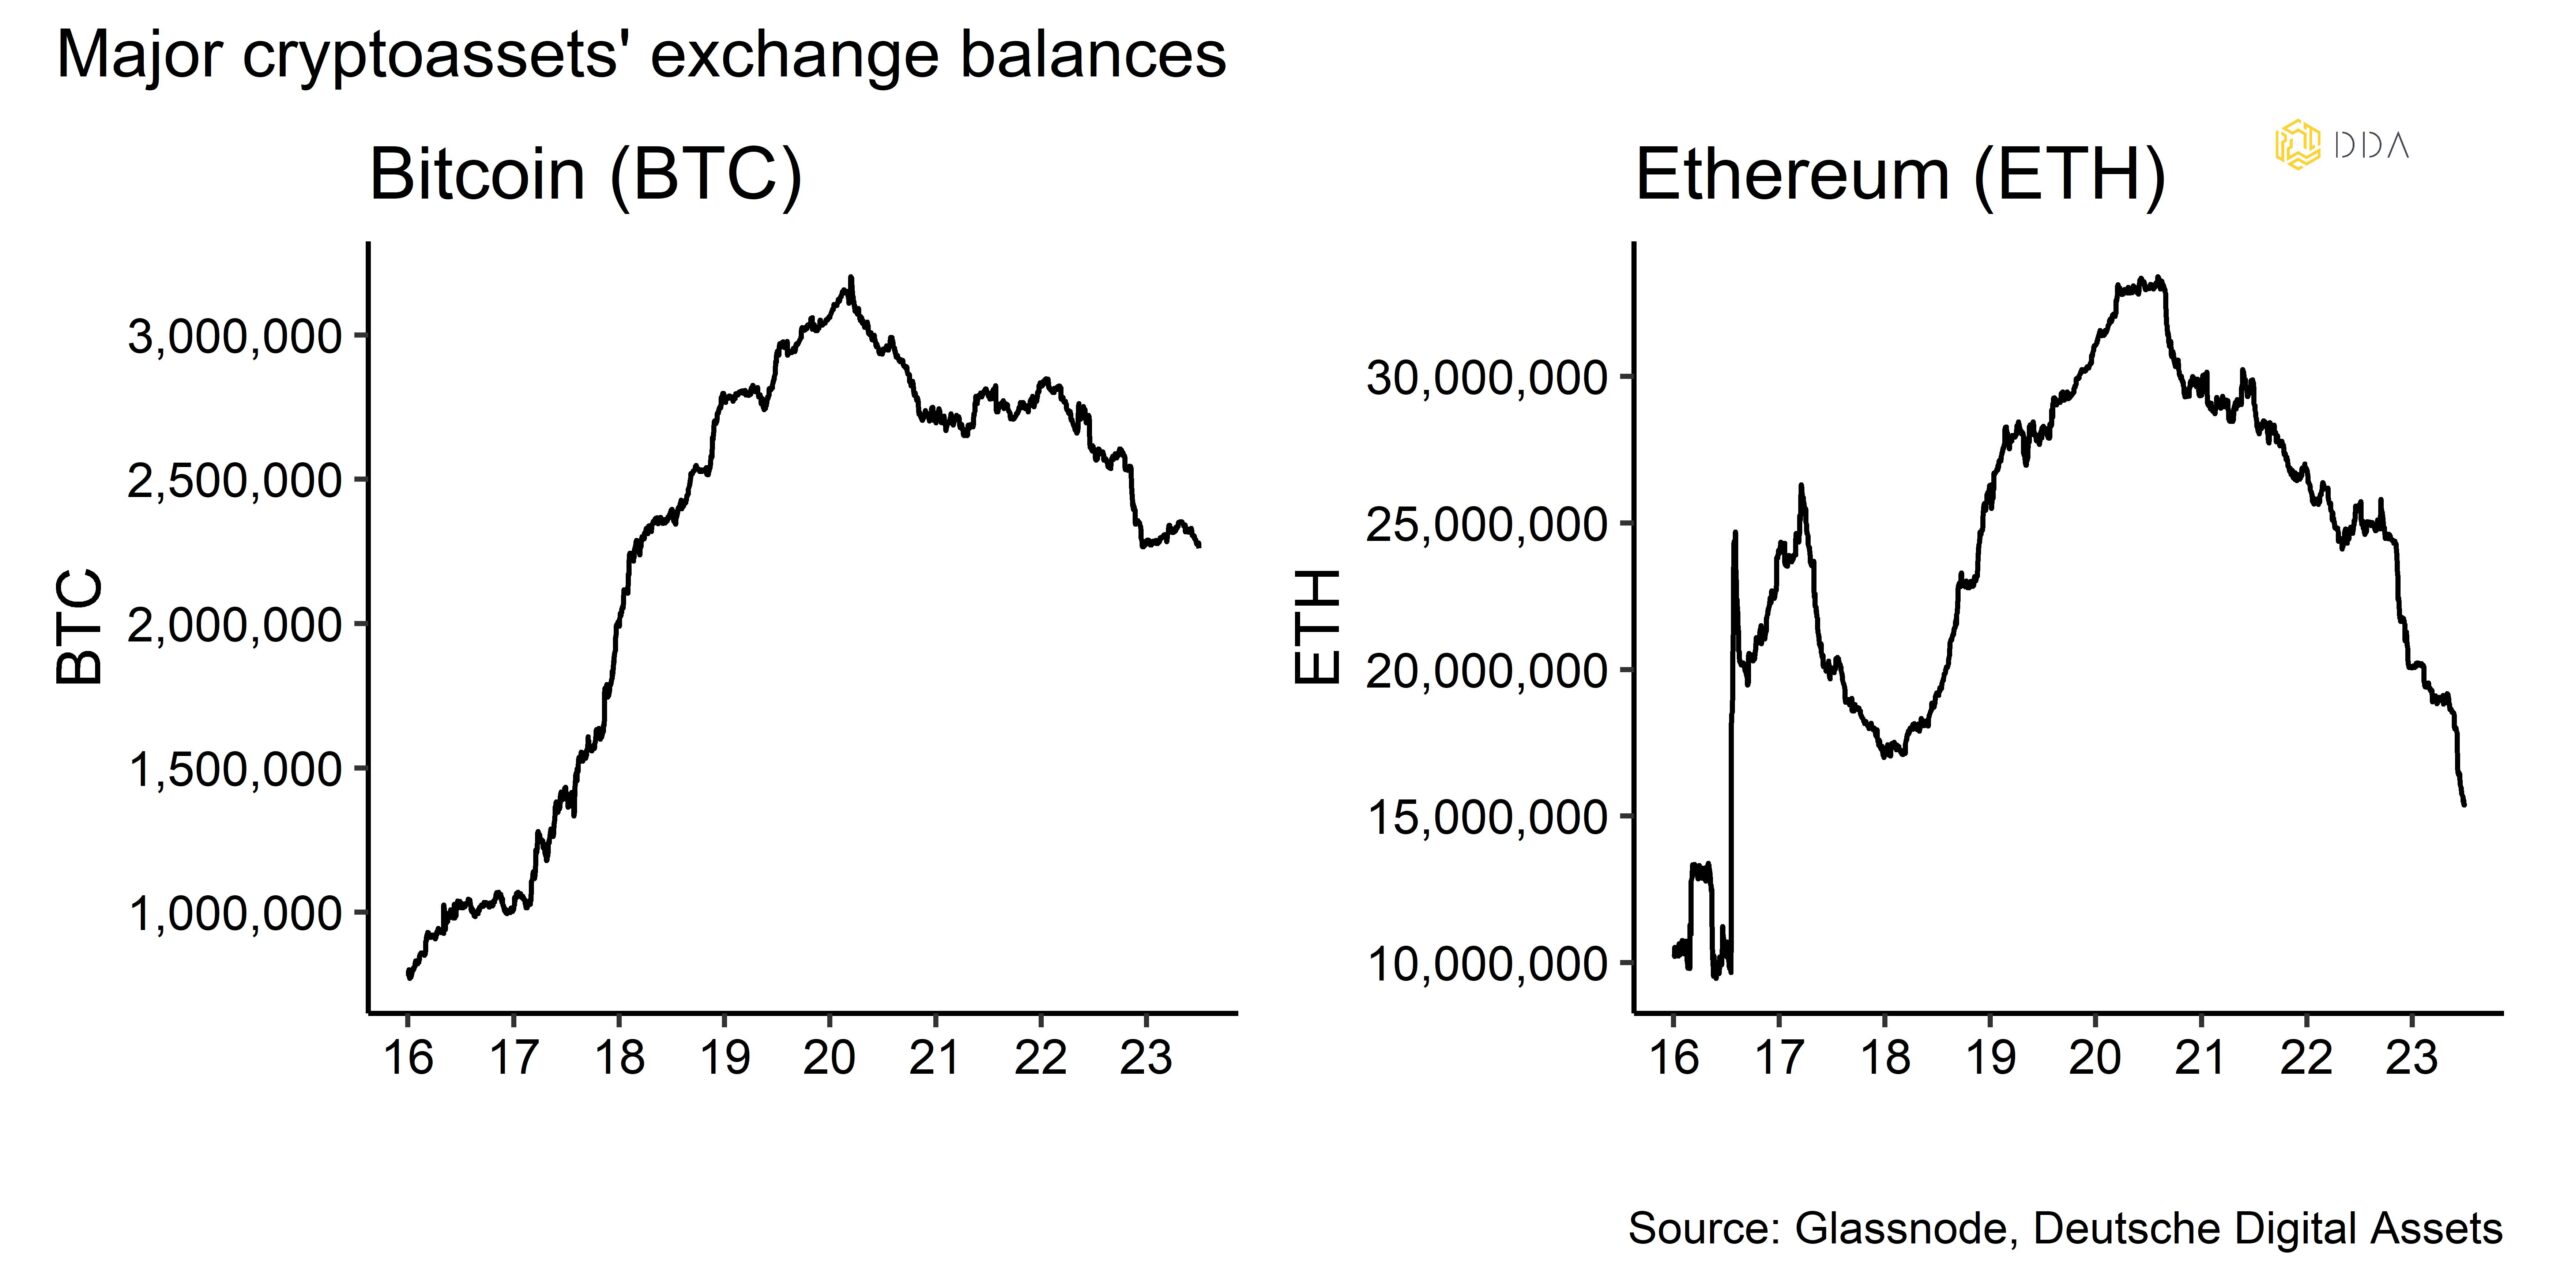
Exchange liquidity is also declining rapidly – this is both true for Bitcoin and particularly true for Ethereum.
While Bitcoin exchange balances have hit a fresh 5-year low, Ethereum exchange balances are already at the lowest level in 7 years. Exchange illiquidity is usually bullish as investors need to bid for a shrinking supply of coins. All else equal, the market clearing price is theoretically higher for the same amount of demand if supply decreases.
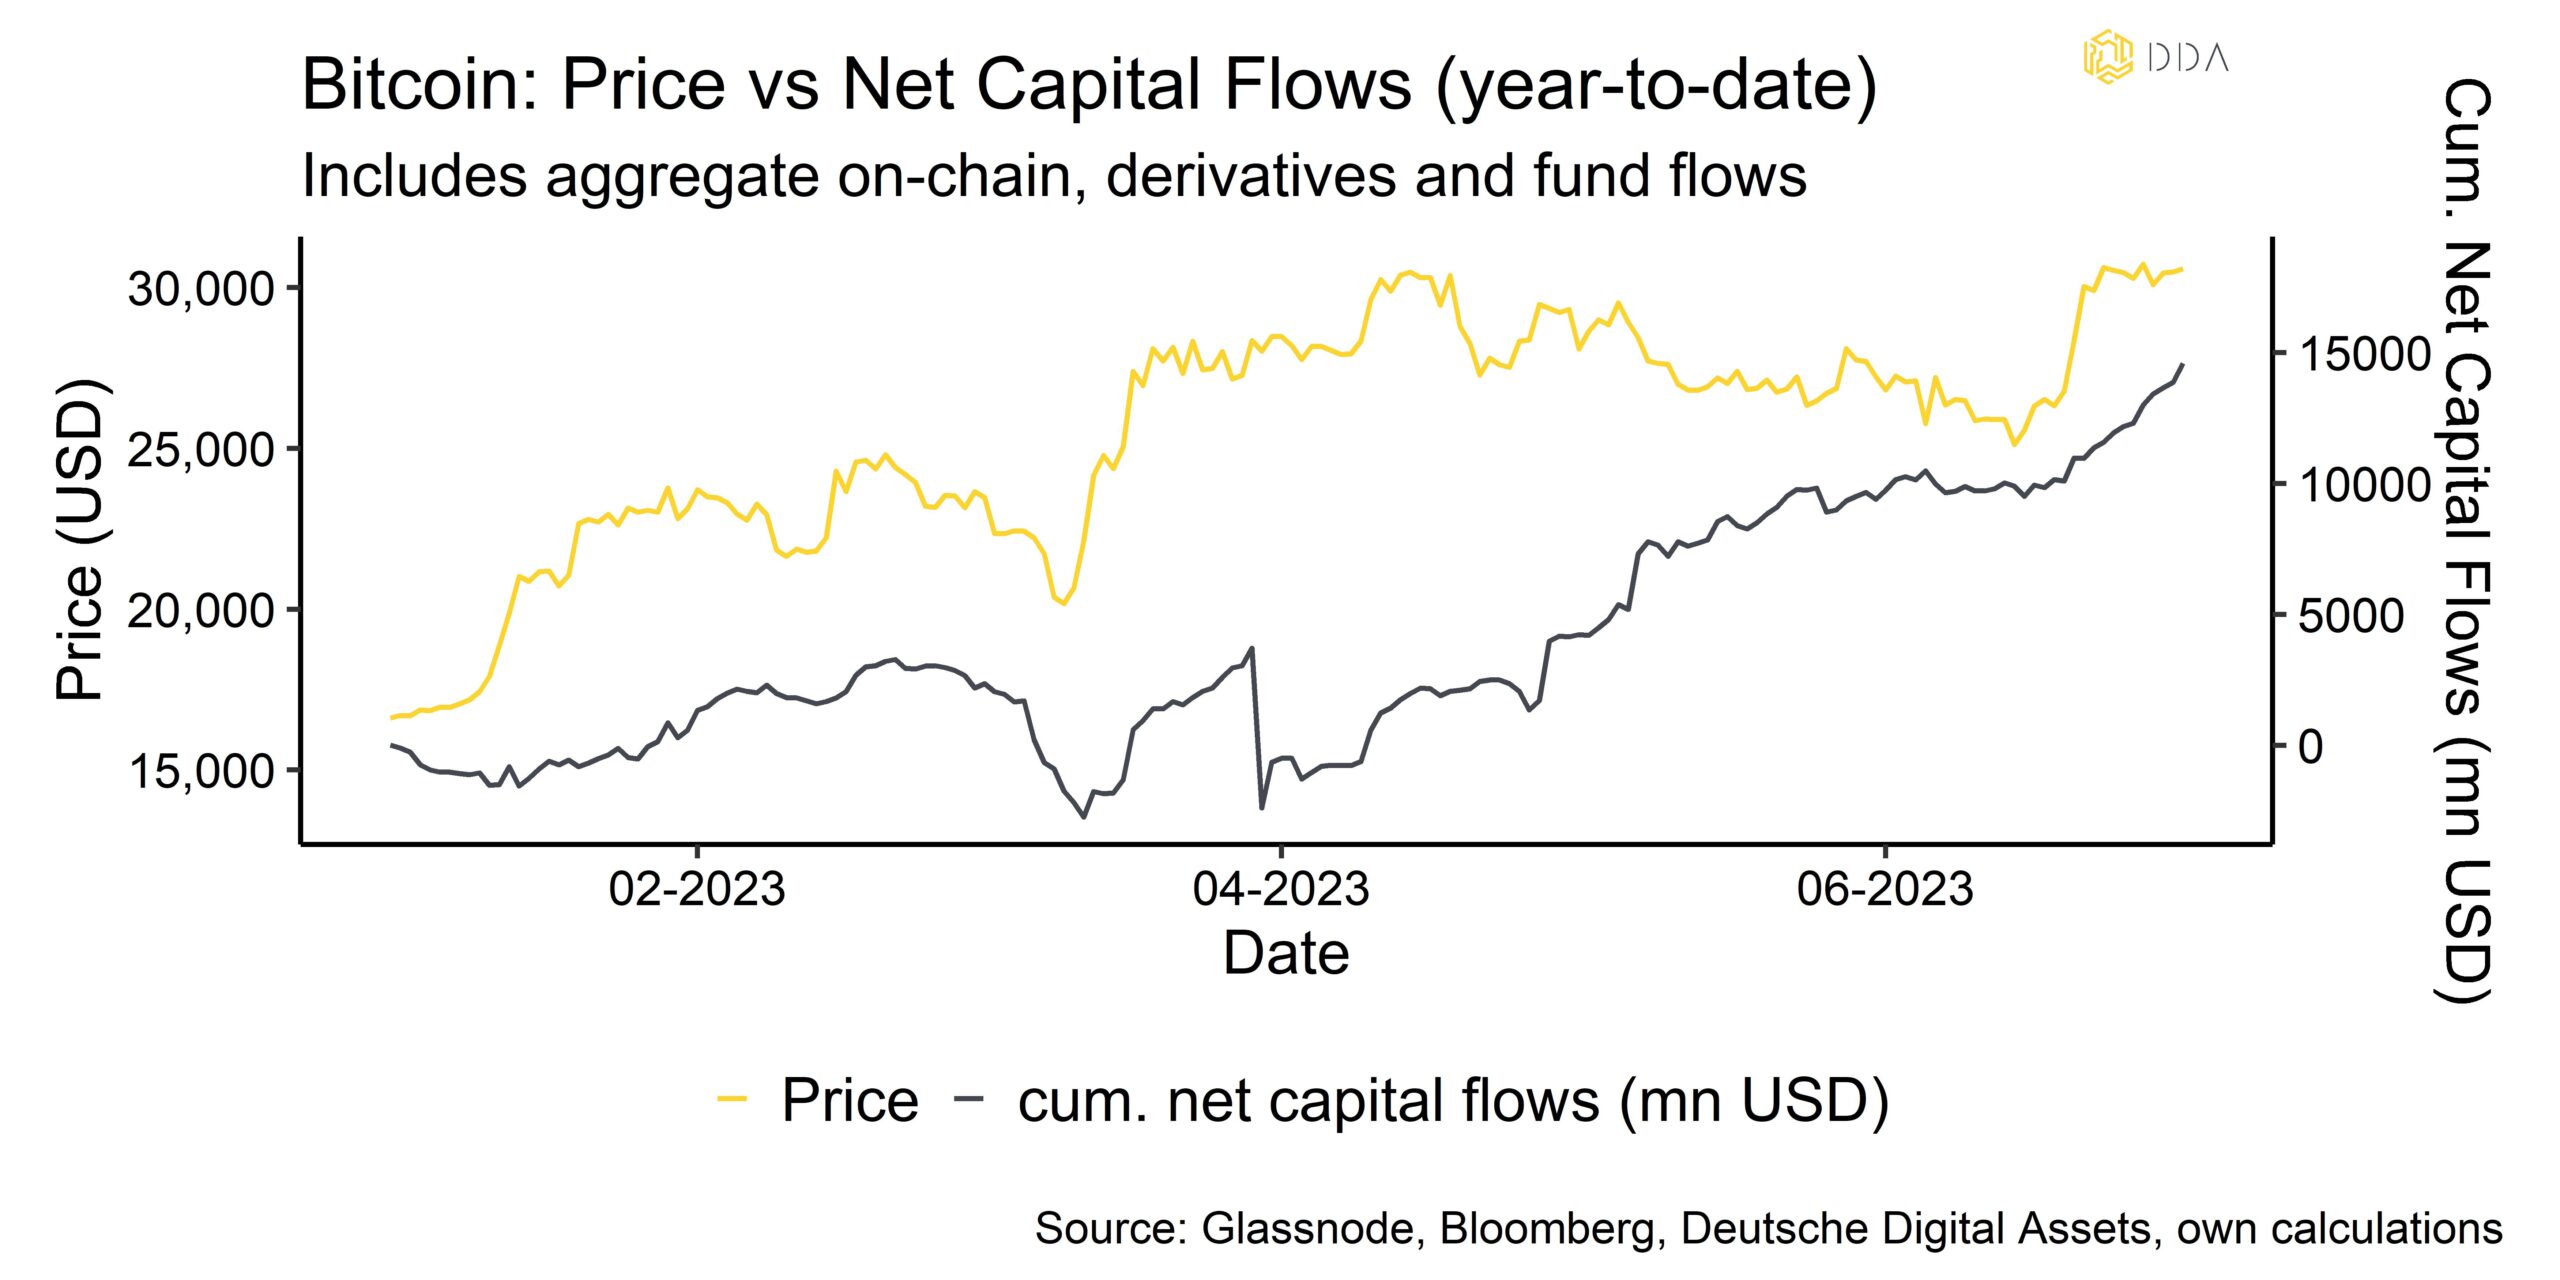
Overall, net capital flows into cryptoassets have picked up significantly compared to last year. Based on our estimations, approximately +14.6 bn USD have flown into Bitcoin on a net basis this year so far which includes on-chain, derivatives (futures, perpetuals and options) and fund flows.
The vast majority of these capital flows into Bitcoin in 2023 happened via on-chain transactions (+14.8 bn USD) while other types of net capital flows were significantly smaller. On-chain inflows into Bitcoin are measured by the cumulative change in realized cap this year.
In comparison, net global Bitcoin fund flows appear to be relatively small. This also implies that market penetration of retail and institutional investors by fund vehicles is still in its infancy and implies significant upside if the recent Blackrock Bitcoin ETF filing sparks further investments via funds.
All in all, in the case of Bitcoin the main investment vehicle still appears to be on-chain transactions and futures/perpetuals while funds and options are still comparatively small.
It is interesting to observe that accumulation activity has increased during the latest SEC-induced correction in prices but has faded again during the subsequent run-up in prices. This implies some “dip-buying” behavior from Bitcoin investors which provides significant support for prices.
The accumulation score represents the weighted-average score of BTC wallet balance changes over a 30-day period.
Apart from the flows side, overall Bitcoin network activity based on transactions and other core on-chain metrics is still near recent all-time highs. However, the growth rate appears to have lost momentum recently. Remember that most of this growth in network activity was due to the rise in inscriptions and BRC-20 tokens issued on Bitcoin.
Bottom Line: Short-term BTC holders realized profits spiked as we approached cost-basis of this investor cohort last month, which provided some floor to prices going forward. In contrast, long-term holders have been very reluctant to either take profits or losses this year as supply illiquidity continues to increase.
Most capital flows into Bitcoin this year happened via on-chain transactions, followed by futures and perpetual flows. However, aggregate net fund flows are still comparatively small which implies significant upside potential for this investment vehicle.
Accumulation patterns this month imply some kind of “dip-buying” behavior by Bitcoin investors. Overall network activity is still near all-time highs but has clearly lost momentum.
About Deutsche Digital Assets
Deutsche Digital Assets is the trusted one-stop-shop for investors seeking exposure to crypto assets. We offer a menu of crypto investment products and solutions, ranging from passive to actively managed exposure, as well as financial product white-labeling services for asset managers.
We deliver excellence through familiar, trusted investment vehicles, providing investors the quality assurances they deserve from a world-class asset manager as we champion our mission of driving crypto asset adoption. DDA removes the technical risks of crypto investing by offering investors trusted and familiar means to invest in crypto at industry-leading low costs.
Legal Disclaimer
The material and information contained in this article is for informational purposes only. Deutsche Digital Assets, its affiliates, and subsidiaries are not soliciting any action based upon such material. This article is neither investment advice nor a recommendation or solicitation to buy any securities. Performance is unpredictable. Past performance is hence not an indication of any future performance. You agree to do your own research and due diligence before making any investment decision with respect to securities or investment opportunities discussed herein. Our articles and reports include forward-looking statements, estimates, projections, and opinions. These may prove to be substantially inaccurate and are inherently subject to significant risks and uncertainties beyond Deutsche Digital Assets GmbH’s control. We believe all information contained herein is accurate, reliable and has been obtained from public sources. However, such information is presented “as is” without warranty of any kind.