
Download the Full Report in PDF
by André Dragosch, Head of Research
Key Takeaways
- The year 2022 was rather hard for cryptoassets as the market has been mired in bear market. Other major asset classes such as stocks or bonds did not perform well either on account of tightening in monetary policy
- However, there is an increasing divergence between market expectations and Fed policy which could increase the risks in the short-term as the US economy still proves to be quite resilient
- However, as the US economy is likely going to fall into recession this year, we expect a gradual easing of monetary policy which should support cryptoassets in 2023. A gradual China re-opening should also help
- There is a been a classical redistribution of coins from short-term to long-term investors, a significant increase in realized & unrealized losses as well as a broad reset of valuations. All these developments are typical for bear markets and have reached levels that are increasingly indicative of a cycle bottom
Chart of the Year
Performance Review
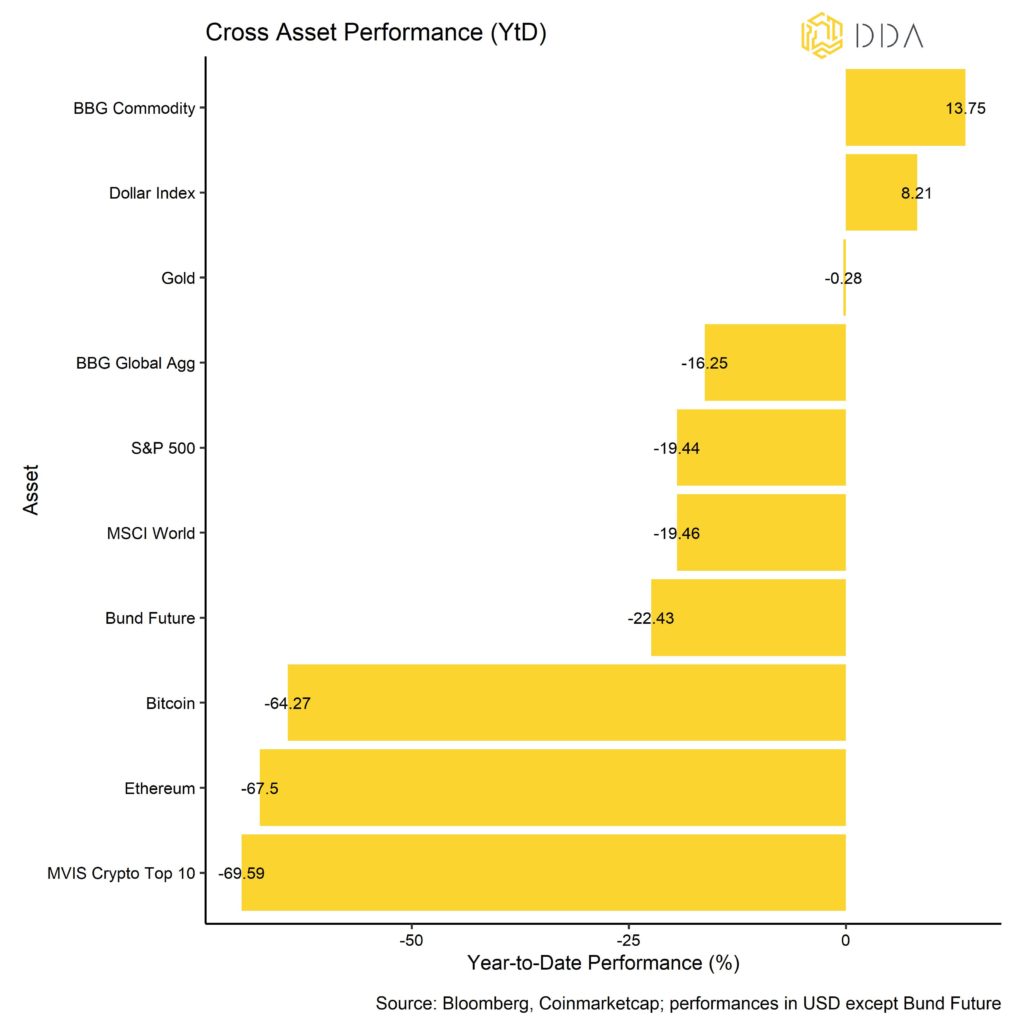
Admittedly, 2022 was a very harsh year for cryptoasset investors but also other asset classes were negatively affected by the tightening in monetary policy of major central banks.
During 2022, cryptoassets were mostly mired in a bear market as were other major asset classes.
As a “rising tide lifts all boats”, the falling tide of liquidity did not leave investors with many choices. In particular, bond investors had a very hard time as last year saw one of the worst bond performances in centuries. Bonds mostly underperformed stocks in 2022.
The increase in interest rates due to monetary policy tightening also affected stocks with a high duration of cash flows very negatively. Among the most affacted stocks were high growth companies such as Tesla, Shopify, or PayPal which experienced similar declines like cryptoassets.
“Cash is king” in this tightening liquidity environment, and investors generally did well who held large proportions of their portfolio in the Dollar.
However, the best-performing asset class were commodities last year due to ongoing supply-constraints that were supercharged by the war in Ukraine and the spike in inflation.
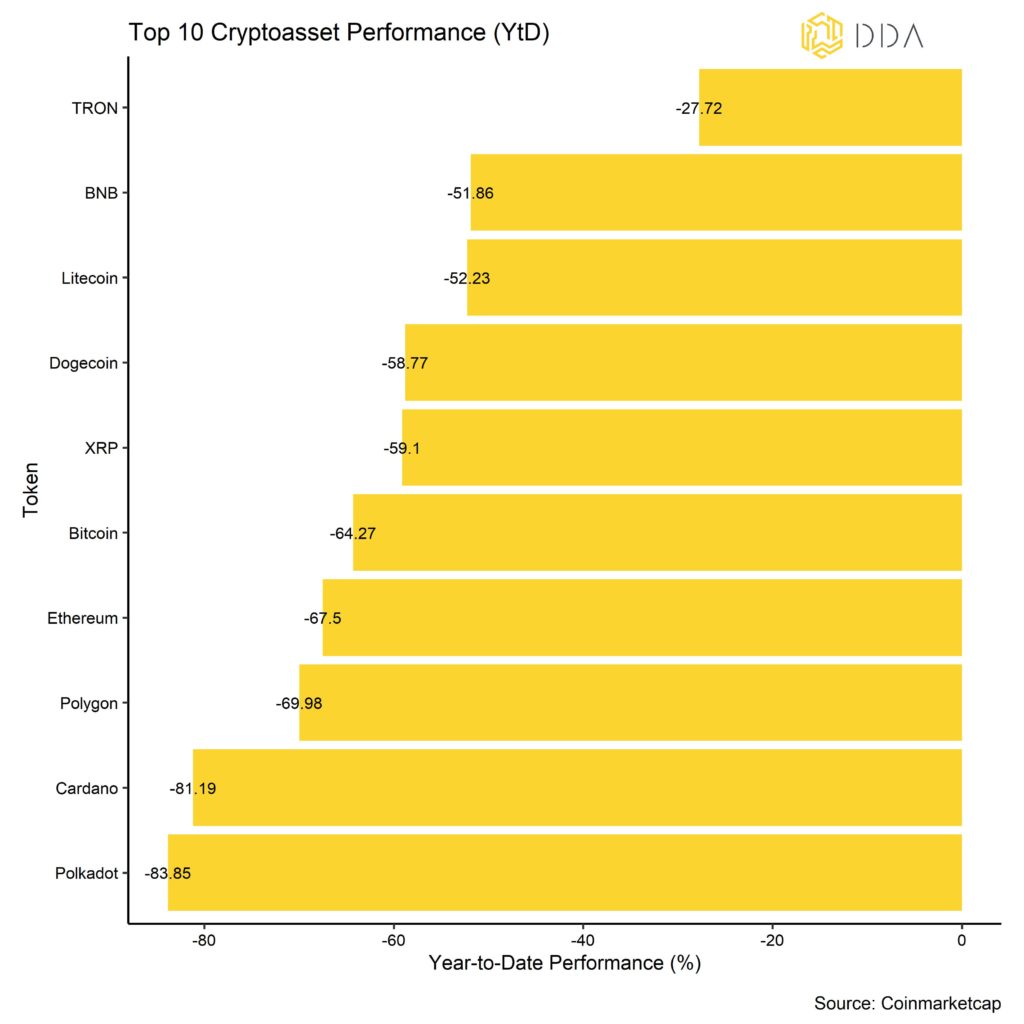
Among the top 10 major cryptoassets, TRON, BNB, and Litecoin have been the main outperformers. Litecoin held up well due to the anticipated halving in August 2023, while BNB’s exchange token was massively propped up by the demise of its main competitor – FTX. TRON prices held up well due to continued purchases of TRON tokens by the TRON DAO Reserve that backs its algorithmic stablecoin USDD. Bitcoin and Ethereum closed the year with -64% and -67%, respectively.
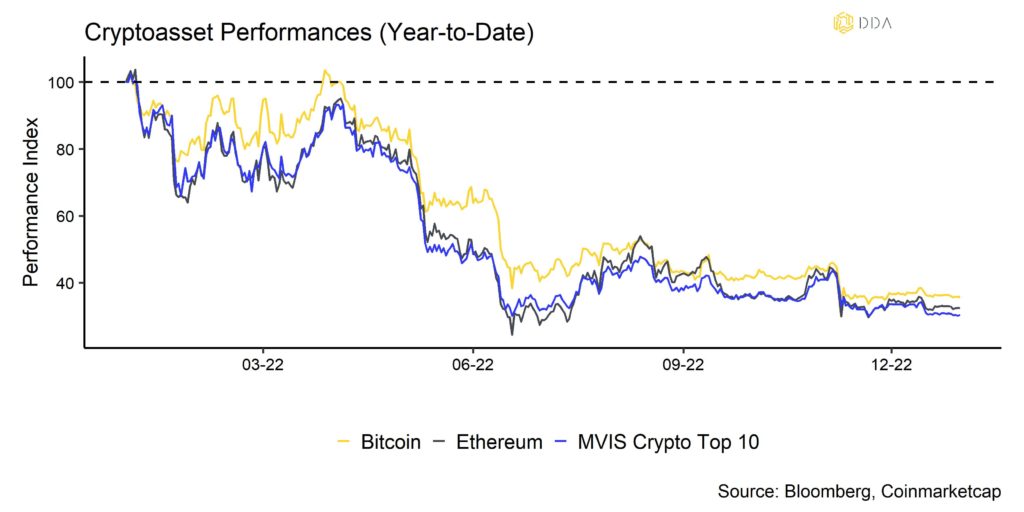
It is important to note that most of the underperformance in 2022 was generated in Q2 2022 with the collapse of the Terra (LUNA) ecosystem in May and the subsequent insolvency of crypto hedge fund 3-Arrows Capital in June. Cryptoassets have mostly traded sideways since then.
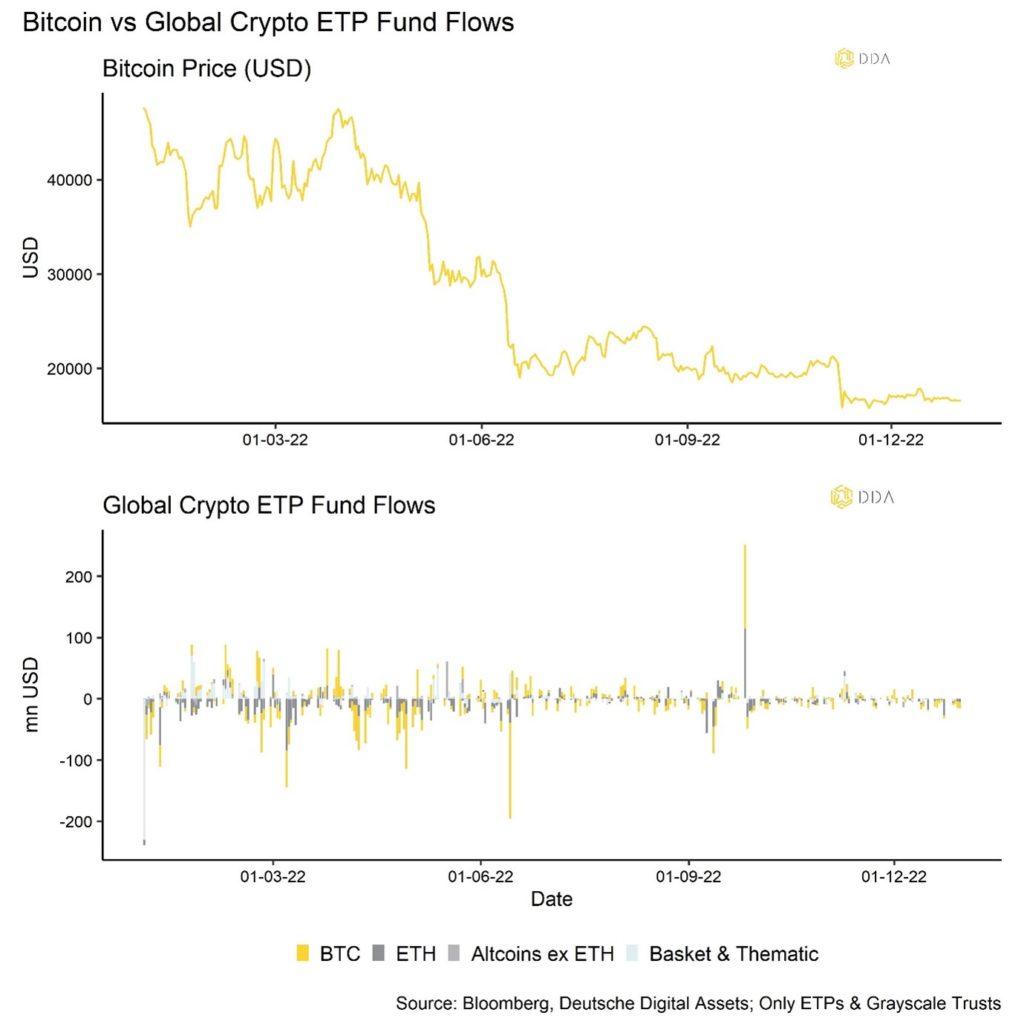
From the institutional side, we have also recorded significant net outflows throughout the year with overall crypto ETP net fund flows totalling -1.15 bn USD in 2022. Most of these outflows also occurred during the first half of the year and have essentially abated in the second half of 2022.
Overall risk appetite for altcoins was relatively low judging by our in-house 1-month Altseason Index (see Appendix). Only 25% of the major Altcoins tracked by the index managed to outperform Bitcoin in December 2022.
Our in-house Crypto Dispersion Index implies that cryptoasset performances was mainly driven by coin-specific factors in the last 30 days. A high reading of the Crypto Dispersion Index implies that average pairwise correlations between Altcoins and Bitcoin are low, meaning Bitcoin and Altcoin do not trade in the same direction and are affected by different factors.
Bottom Line: The year 2022 was rather hard for cryptoassets as the market has been mired in bear market. Other major asset classes such as stocks or bonds did not perform well either on account of the tightening in monetary policy. High growth stocks such as Tesla, Shopify or PayPal experienced similar drawdowns like cryptoassets. Only commodities and the Dollar performed well last year
Macro & Markets Commentary
Last year’s major talking points are continuing in the new year as well: Ongoing geopolitical tensions, rising recession risks and tight monetary policy are still very much on investors’ menus this year as well.
Concerning monetary policy, one of the major events during December was probably the FOMC meeting on the 14/12/2022. The Fed struck a rather hawkish tone despite another CPI inflation release which underwhelmed expectations just one day before the meeting.
More specifically, US CPI inflation for November 2022 came in at 7.1% while the consensus expected 7.3% after 7.7% in October 2022. So, US inflation declined again compared to last month and even more than the consensus expected. The initial market reaction was very positive both for cryptoassets and traditional financial assets, and Bitcoin was up more than 4% on that day. Nonetheless, the Fed increased its key interest rate by 50 basis points and vowed to keep interest rates higher for longer than expected in order to tame inflation.
Based on its own projections, the FOMC now sees the terminal rate (the highest potential Fed Funds Rate in the cycle) above 5%. Market expectations, however, are well below that level (~4.9% in June ’23). An increasing divergence could put the market on a collision course with the Fed if the Fed continued to hike rates despite further negative surprises in both inflation and employment.
We also saw a relatively hawkish tone by the ECB who also increased key interest rates by 50 basis points. The ECB said it would need to raise rates “significantly” further to tame inflation.
This led to an overall bearish risk sentiment across risky assets such as US equities throughout December. The “Santa Rallye”, as most investors have expected, was crushed by the Fed.
Notwithstanding, we think that the inflation cycle downturn should continue to be a tailwind for cryptoassets going forward. The reason is that inflation downturns are usually associated with negative inflation surprises, ie inflation numbers that underwhelm consensus expectations (right chart).
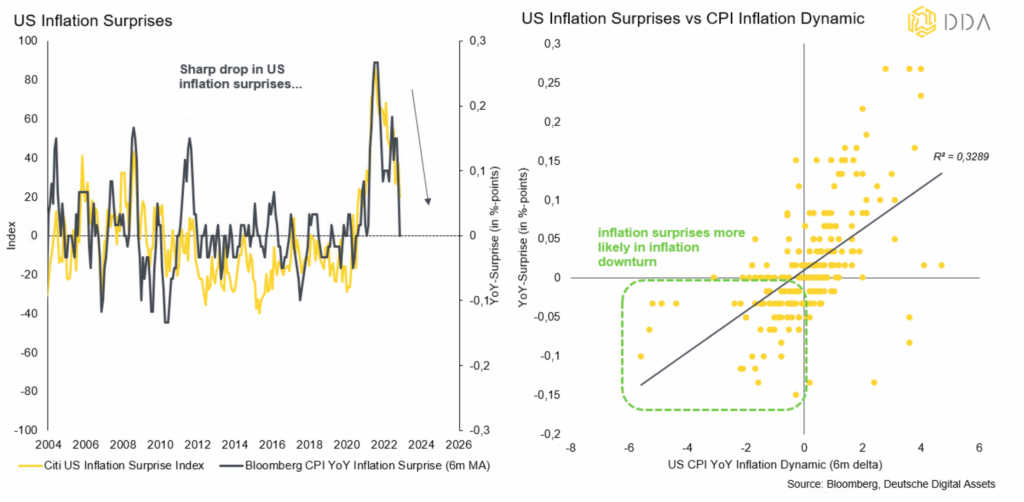
Inflation surprises have come down significantly but we think that this is likely going to continue throughout next year. In fact, based on our in-house money supply inflation model, we forecast a continued decrease in US inflation rates until May 2024, when inflation is most-likely going to reach 1.2% YoY before commencing a new inflation cycle upturn.
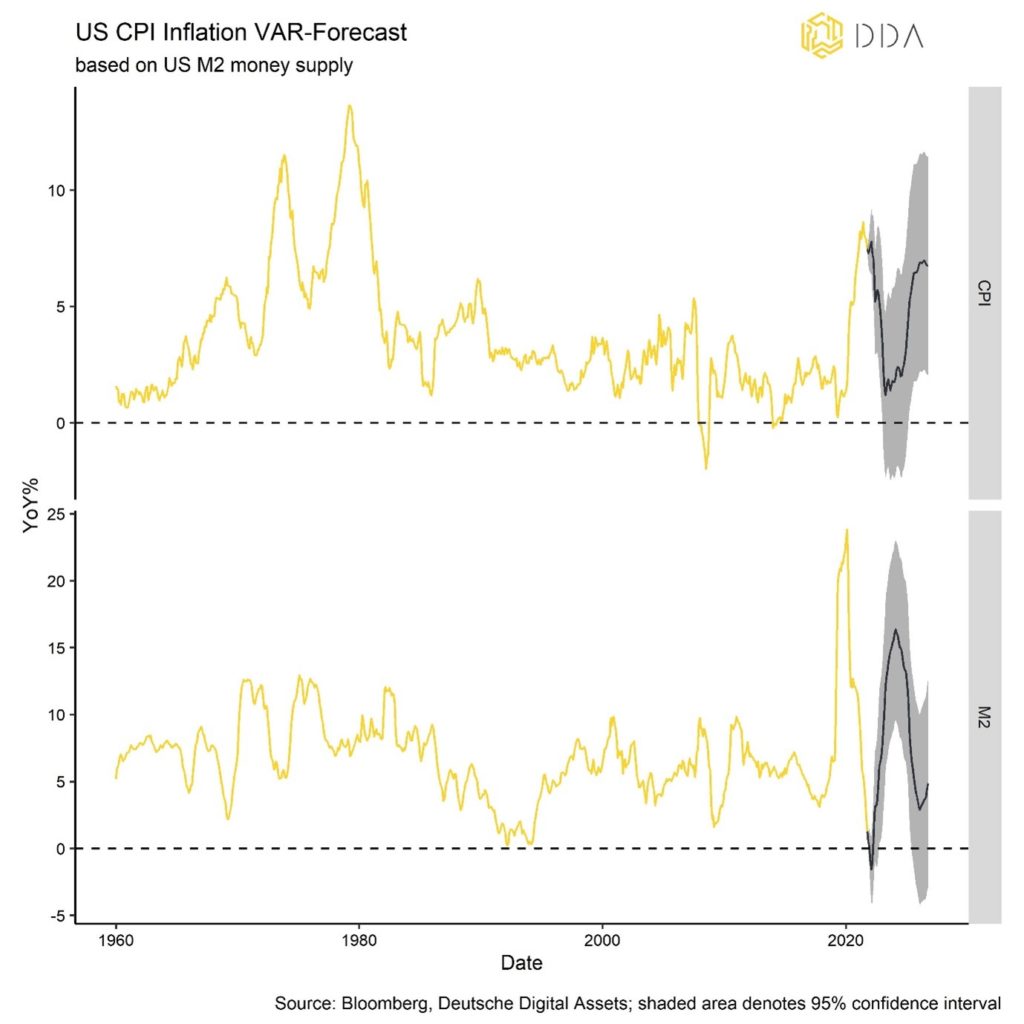
That being said, we generally think that market-based US inflation expectations over the medium term are still too low since we expect US inflation rates to average around 4.5% while the market currently expects 2.5% on average in the next 5 years (CPI Swaps).
In this regard, assets that are sensitive to rising inflation expectations such as Bitcoin should be central portfolio holdings as we recently argued in our latest deep dive. You can find the full report here.
With respect to US employment, we have seen a significant increase in layoff announcements so far in November 2022 (+416% YoY Challenger, Grey & Christmas survey) that still needs to show up in official employment statistics. However, there has been no significant increase in other leading employment indicators so far that investors are keeping a close eye on such as initial unemployment claims. We are still convinced that any significant weakness in US employment will be interpreted as bullish by financial markets and cryptoassets since it would imply a more moderate stance of monetary policy going forward.
Google search queries for “filing for unemployment” have been picking up lately but without any significant spike so far. Despite some serious fallout in the US housing market, the US economy and especially employment have not felt the pain of the economic slowdown, yet, and appear to be surprisingly resilient.
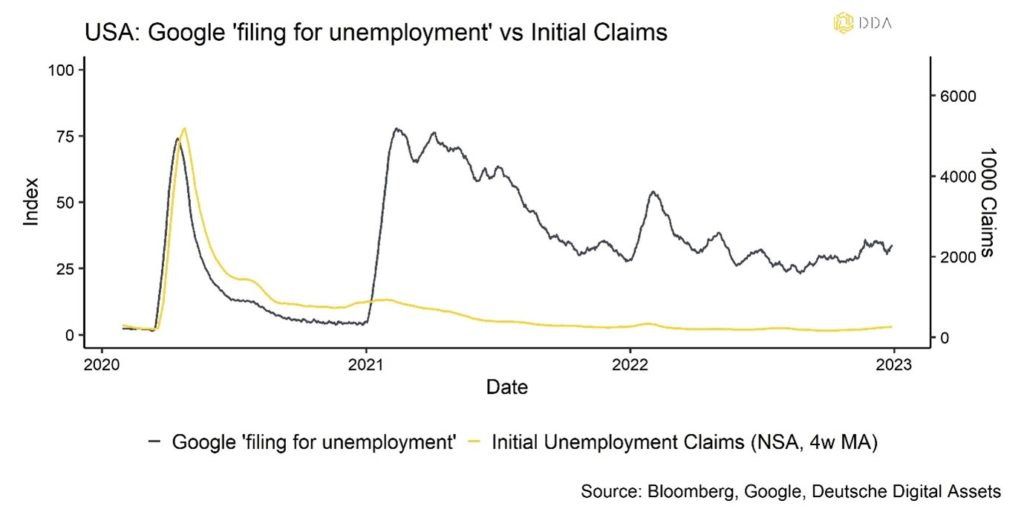
We will keep a close eye on future developments and inform our readers as soon as we notice a significant change.
Another big topic among investors is the story that China appears to finally re-open its economy and partially lift its harsh Covid-restrictions. This comes after a salvo of very disappointing macro data from China, especially from the industrial and construction sector.
Overall, Chinese economic and travel activity remains depressed but has been recovering as can be seen in the low levels of daily metro passenger volumes in the capital Beijing:
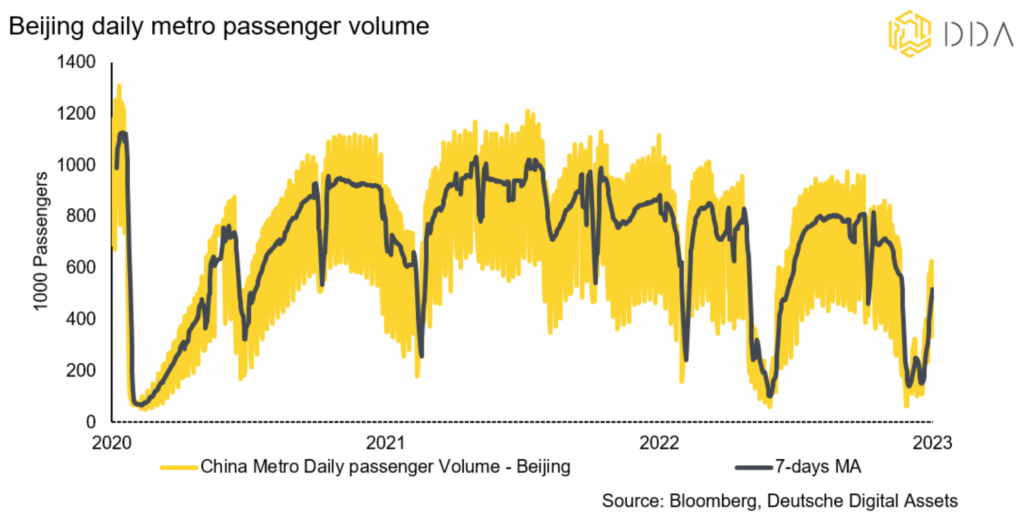
At the same time, important leading indicators such as the Chinese credit impulse have already been increasing the last 6 months. All in all, it is quite likely that the economy is going to gain momentum in the coming months.
The reason why that is relevant for crypto investors is that both global growth expectations, due to China’s re-opening, and monetary policy headwinds by tight US central bank policy appear to be fading out gradually. This should be a tailwind for cryptoassets and in particular Bitcoin in 2023.
It is important to note though that Bitcoin variations currently appear to be both explained by changes in global growth expectations and monetary policy expectations to the same degree. While global growth expectations have declined recently in line with falling bond yields, monetary policy expectations have improved (see appendix). So, we have diverging market forces that currently support but at the same time hold back Bitcoin.
Bottom Line: While monetary policy expectations have been improving due to a more moderate stance in US monetary policy, global growth expectations have declined the last month. So, we still have mixed signals from the macro side for Bitcoin and cryptoassets.
A gradual re-opening of the Chinese economy should support global growth expectations in the coming months. Falling US inflation surprises should also provide a tailwind. However, there is an increasing divergence between market expectations and Fed policy which could increase the risks in the short-term as the US economy still proves to be quite resilient. However, as the US economy is likely going to fall into recession this year, we expect a gradual easing of monetary policy which should support cryptoassets in 2023.
On-Chain Analytics
Overall, on-chain developments were characterized by 3 major points in 2022:
- Redistribution of coins from short-term to long-term investors
- Significant amount of realized & unrealized losses
- Reset of valuations
Bear markets usually redistribute the supply of coins from short-term pessimists to long-term optimists. This bear market is no different.
So far, we have seen a significant increase in the supply of coins last active over 1 year as well as the % of realized cap with holding periods in excess of 5 months which is usually a threshold for long-term investors.
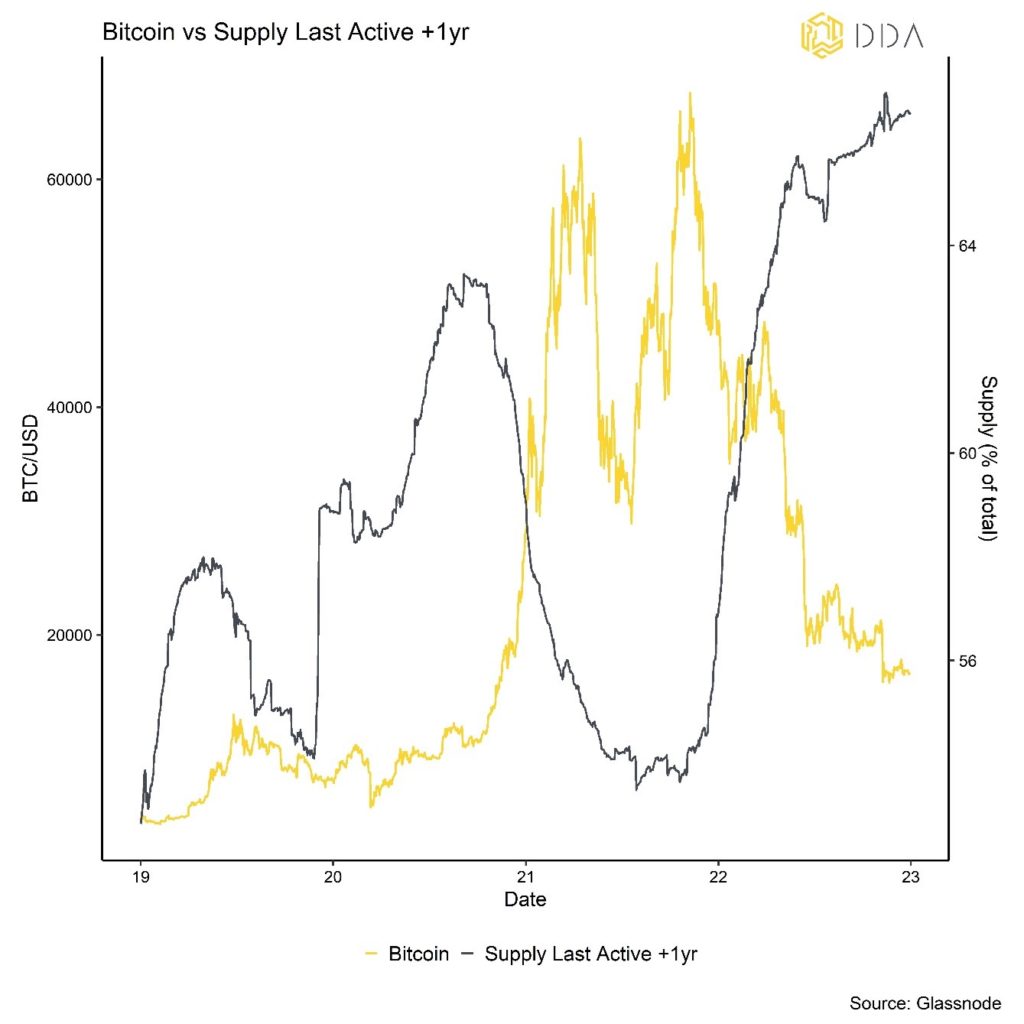
Bear markets are usually characterized by a decrease in short-term investors and a lack of “new” money. In 2022, short-term investors have mostly exited the market which is why the market was mired in a bear market most of the time.
Throughout the year, investors have also amassed a significant amount of both realized and unrealized losses on-chain.
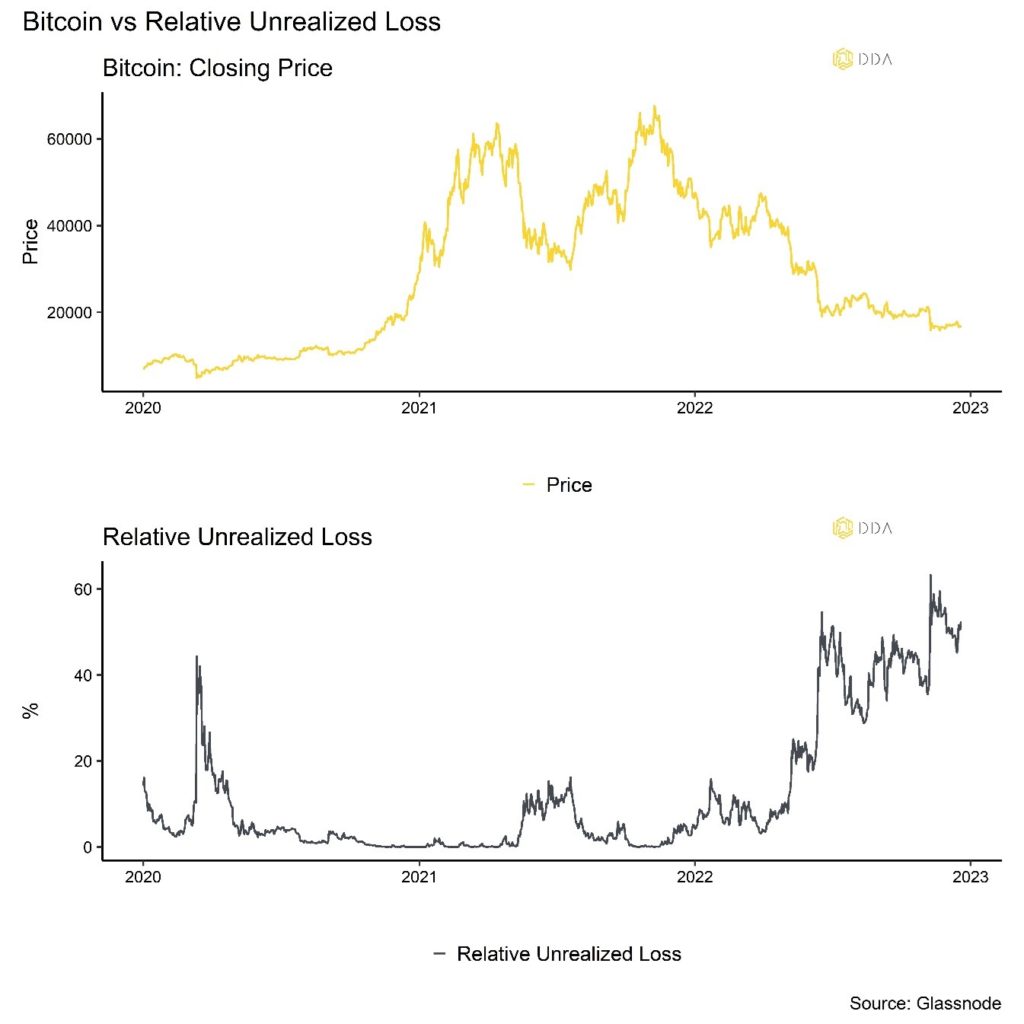
The good news is that all the abovementioned factors are usually indicative of cycle bottoms:
In theory, market bottoms happen when the supply of coins has been redistributed from short-term to long-term holders, selling pressure has been exhausted and cheap valuations start to attract a new cohort of investors. This process appears to have started already judging by our in-house “Accumulation Scores” for smaller wallet cohorts from 0.01 BTC to 10 BTC. This cohort has shown a very strong accumulation behaviour since November 2022 (see appendix). A large number of losses is also indicative of a cycle bottom.
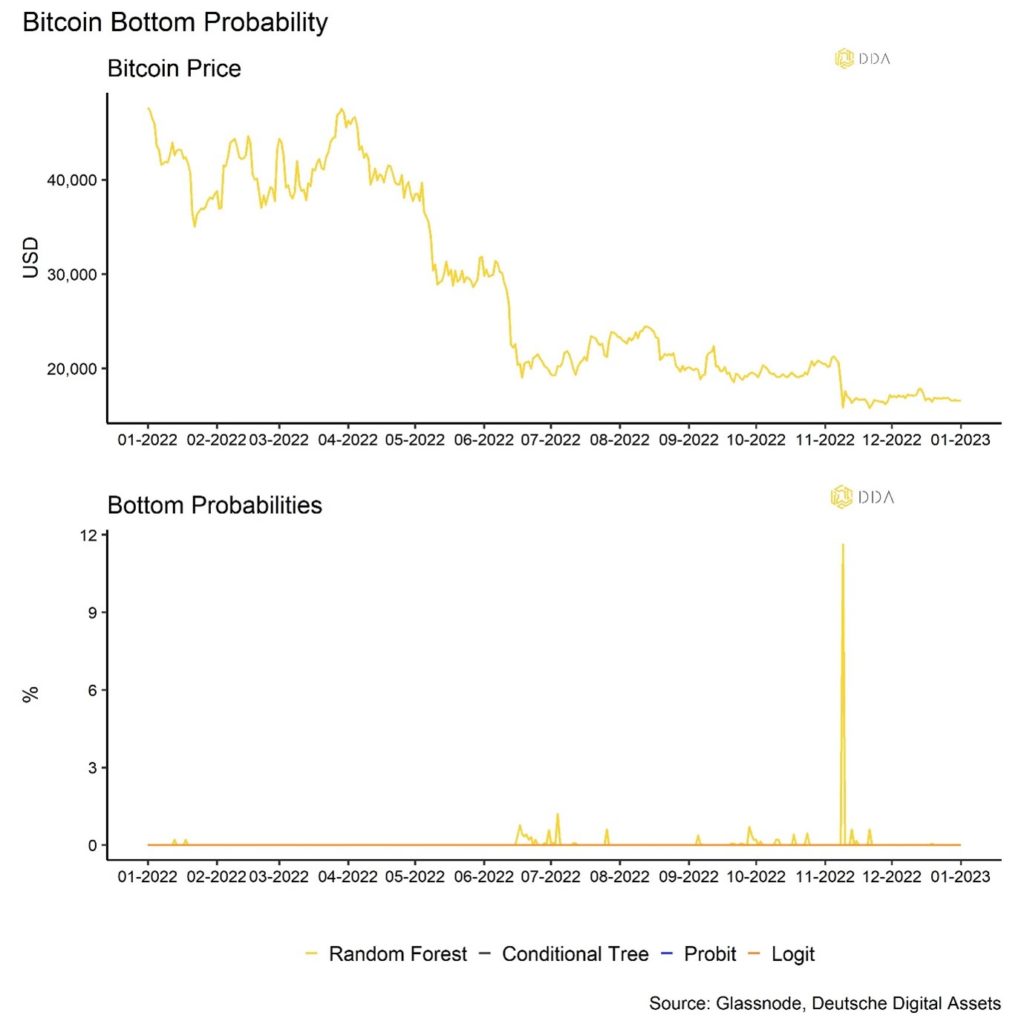
In fact, we have seen significant progress on these points to the extent that our in-house Bitcoin bottom probability started to increase in November 2022. This is also shown by our Chart of the Year. For more information on this indicator, please refer to this article or the appendix of this report. Although the overall probability is not high yet, it still implies that we are closely approaching the bottom in this cycle.
At the same time, we have seen a reset in valuations to attractive levels again. In fact, our composite valuation indicator that consists of 7 different valuation metrics for Bitcoin is at levels last seen at previous cycle bottoms (light yellow dots):
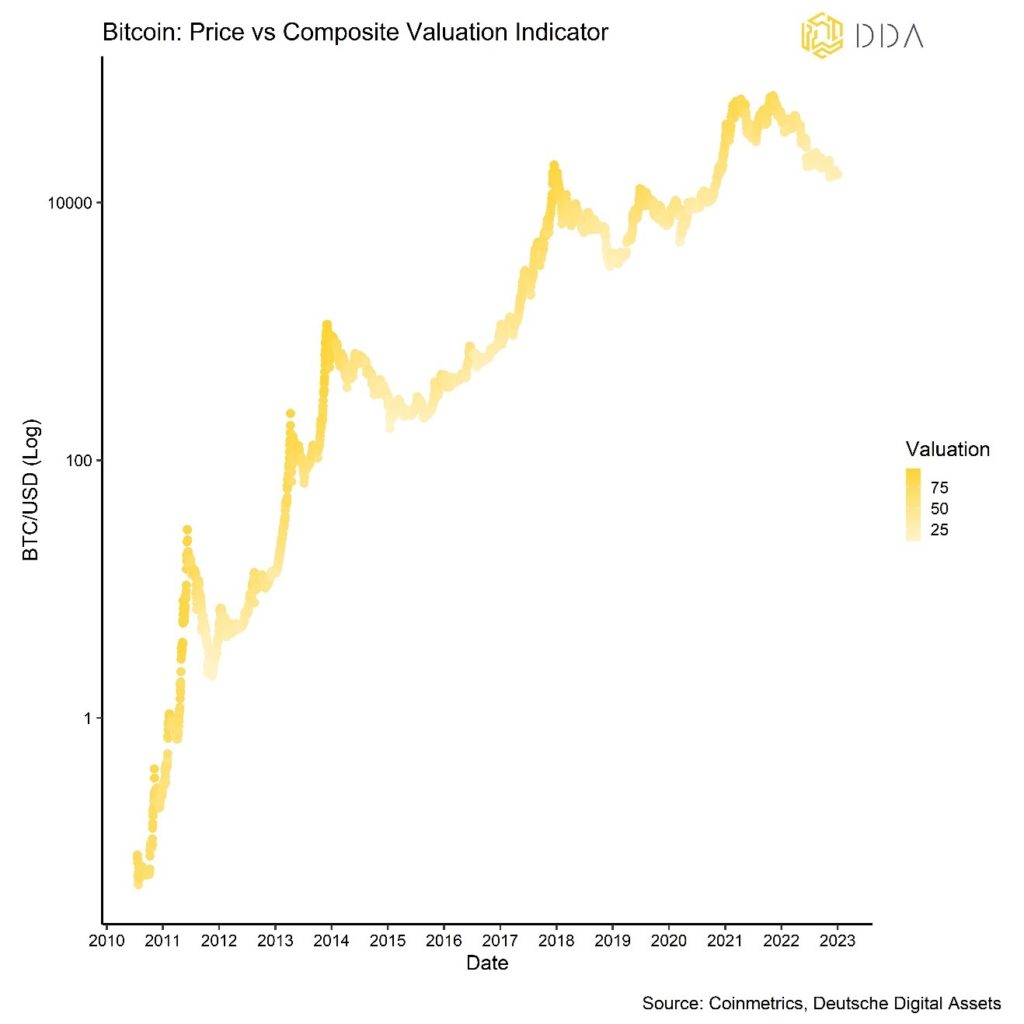
This increases the probability that a new cohort of investors will enter the market and put a floor on the current price levels.
Another interesting on-chain development in December was the fact that there was a significant drop in Bitcoin hash rate due to the blizzard in the US that led most US miners to temporarily shut down their mining rigs. The sharp drop in hash rate led to an increase in the model gap between the current price & ‘fair value’ predicted by the stock-to-flow-model (see appendix).
At one point during the decline, the model put 12-months forward performance shortly at ~895%. Hash rate determines the flow of newly produced coins and since difficulty adjustment only happens every 2016 blocks, flow changes on a daily basis.
Therefore, a drop in hash rate leads to an increase in the stock-to-flow ratio, all else equal. Please note that there is, if anything, only a long-term relationship present between price and the stock-to-flow ratio. That being said, there appears to be a close relationship between stock-to-flow model deviations/residuals and subsequent 12-months returns as shown in the chart.
However, crypto market sentiment was still dominated by bearish news flow in December. Exchange behemoth Binance came under pressure as the market started to question the veracity of its “proof-of-reserves” audit conducted by Mazars. The reason is that Mazars recently withdrew from working with Binance. Checks for proof of reserves comprise confirming that a financial organization can cover its clients’ funds.
As a result, Binance faced significant withdrawals throughout December as there were rumors of a “Flywheel scheme” comparable to FTX. A Flywheel scheme involves a token that is artificially inflated via sophisticated marketing strategies and insider buying to raise the overall market value that can then be used to acquire more assets via collateralized loans based on these inflated token prices.
We also saw significant exchanges from BUSD (Binance’s USD stablecoin) balances into Tether USD (USDT) and USD Coin (USDC) on account of rising risk aversion. However, these outflows and exchanges appear to have levelled off.
Another major talking point among cryptoasset investors was the news that the manager of the biggest Bitcoin Fund in the world – Grayscale – intends to redeem up to 20% of its Grayscale Bitcoin Trust’s (GBTC) shares in case the SEC disapproves the Trust to be converted into an ETF.
If that happened, Grayscale would most-likely liquidate the underlying Bitcoin in order to honour the share redemptions.
The Grayscale Bitcoin Trust currently holds around 632k BTC and 20% of this would imply a potential liquidation of around 126k BTC.
In order to assess the potential price impact of this, consider the following liquidation events in 2022:
- May 2022: LUNA Foundation guard liquidates around 80k BTC / 685k BTC in exchange inflows in 7 days.
BTC price impact: 36566 USD → 28900 USD (-21%)
- June 2022: Insolvency of Hedge Fund 3-Arrows Capital (3AC) / 659k BTC in exchange inflows in 7 days
BTC price impact: 28359 USD → 19021 USD (-32%) - November 2022: Insolvency of FTX exchange and Alameda Research / 499k BTC in exchange inflows in 7 days
BTC price impact: 21276 USD → 16798 USD (-21%)
Please note that exchange inflows are usually indicative of selling intentions by investors and are here taken as proxy for selling volume. However, exchange inflows are not identical with selling volume.
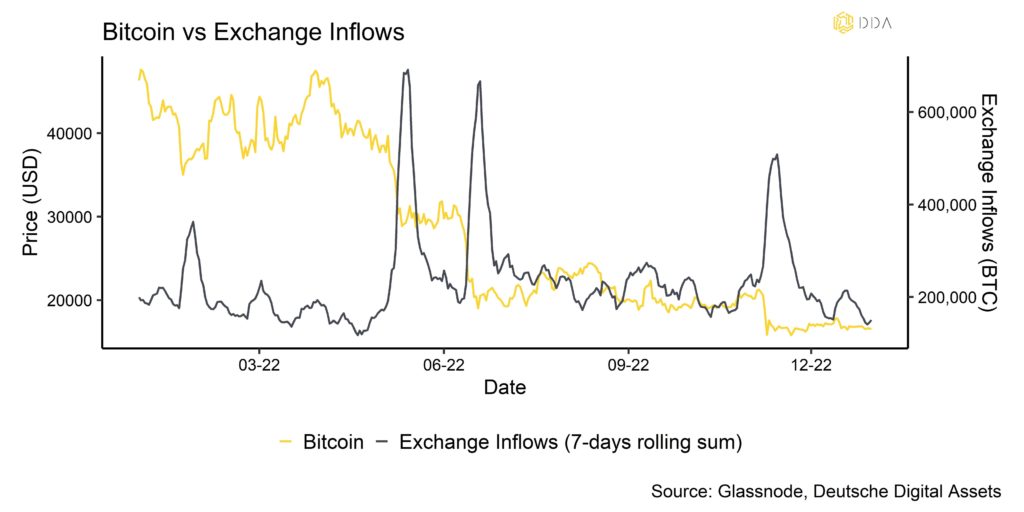
The abovementioned liquidation examples highlight that the price impact should be limited if those liquidations by Grayscale (approximately 126k BTC) will not accompanied by additional exchange inflows due to heightened risk aversion among investors. But the ultimate market impact will also depend on other factors such as overall exchange liquidity conditions or institutional fund flows off-chain.
As a rough rule-of-thumb, every 100k BTC was associated with a BTC price decline of around -12% in 2022 within 7 days. So, we would expect Grayscale’s potential liquidation to have a price impact between -10% and -15% in Bitcoin.
Bottom Line: Bear markets usually redistribute the supply of coins from short-term pessimists to long-term optimists. This bear market is no different. There is a been a classical redistribution of coins from short-term to long-term investors, a significant increase in realized & unrealized losses as well as a broad reset of valuations. All these developments are typical for bear markets and have reached levels that are increasingly indicative of a cycle bottom. However, a potential selling of Grayscale Bitcoin Trust holdings’ could put further downside pressure on the market in the short term.
Download the full report with appendix here.
Legal Disclaimer
The material and information contained in this article is for informational purposes only. Deutsche Digital Assets, its affiliates, and subsidiaries are not soliciting any action based upon such material. This article is neither investment advice nor a recommendation or solicitation to buy any securities. Performance is unpredictable. Past performance is hence not an indication of any future performance. You agree to do your own research and due diligence before making any investment decision with respect to securities or investment opportunities discussed herein. Our articles and reports include forward-looking statements, estimates, projections, and opinions. These may prove to be substantially inaccurate and are inherently subject to significant risks and uncertainties beyond Deutsche Digital Assets GmbH’s control. We believe all information contained herein is accurate, reliable and has been obtained from public sources. However, such information is presented “as is” without warranty of any kind.


