Crypto Market Intelligence October 2023
von André DragoschLeiter der Forschung
Wichtigste Erkenntnisse
- Crypto assets outperformed traditional assets in September as tighter US monetary policy affected all kinds of markets negatively
- A variety of factors could eventually lead to a reversal in US monetary policy which would be very bullish for crypto assets.
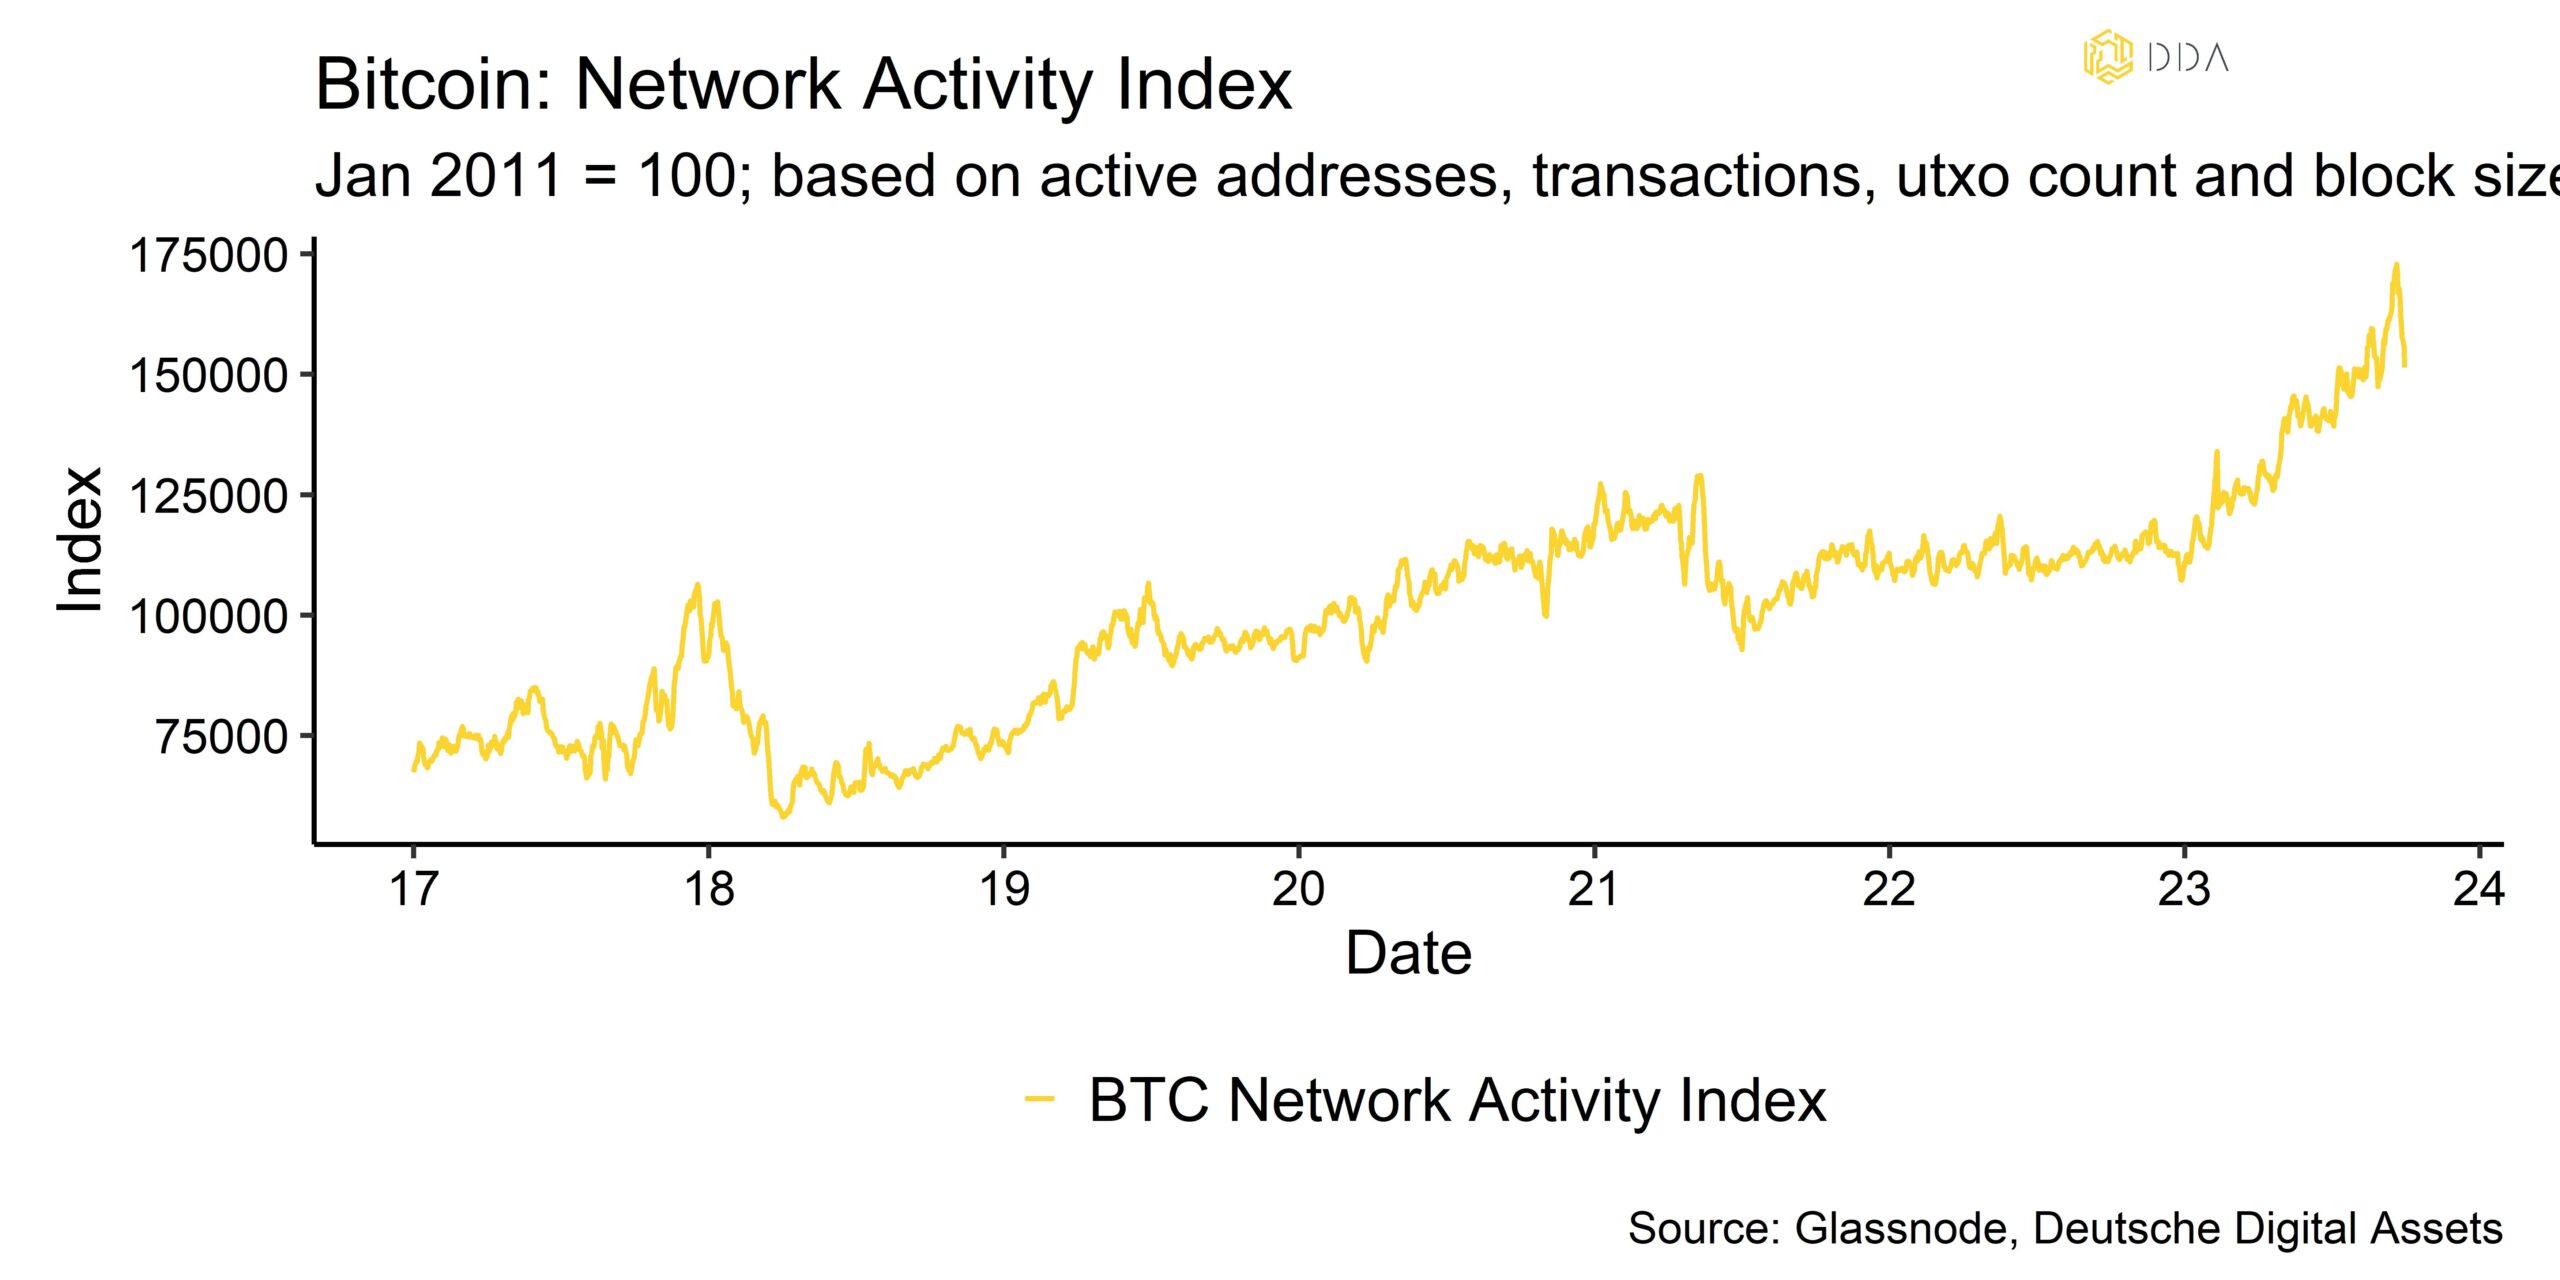
- September was a very strong month for Bitcoin on-chain developments as many network metrics such as transaction count or hash rate reached new all-time highs.
Chart of the month
Kryptoasset Leistung
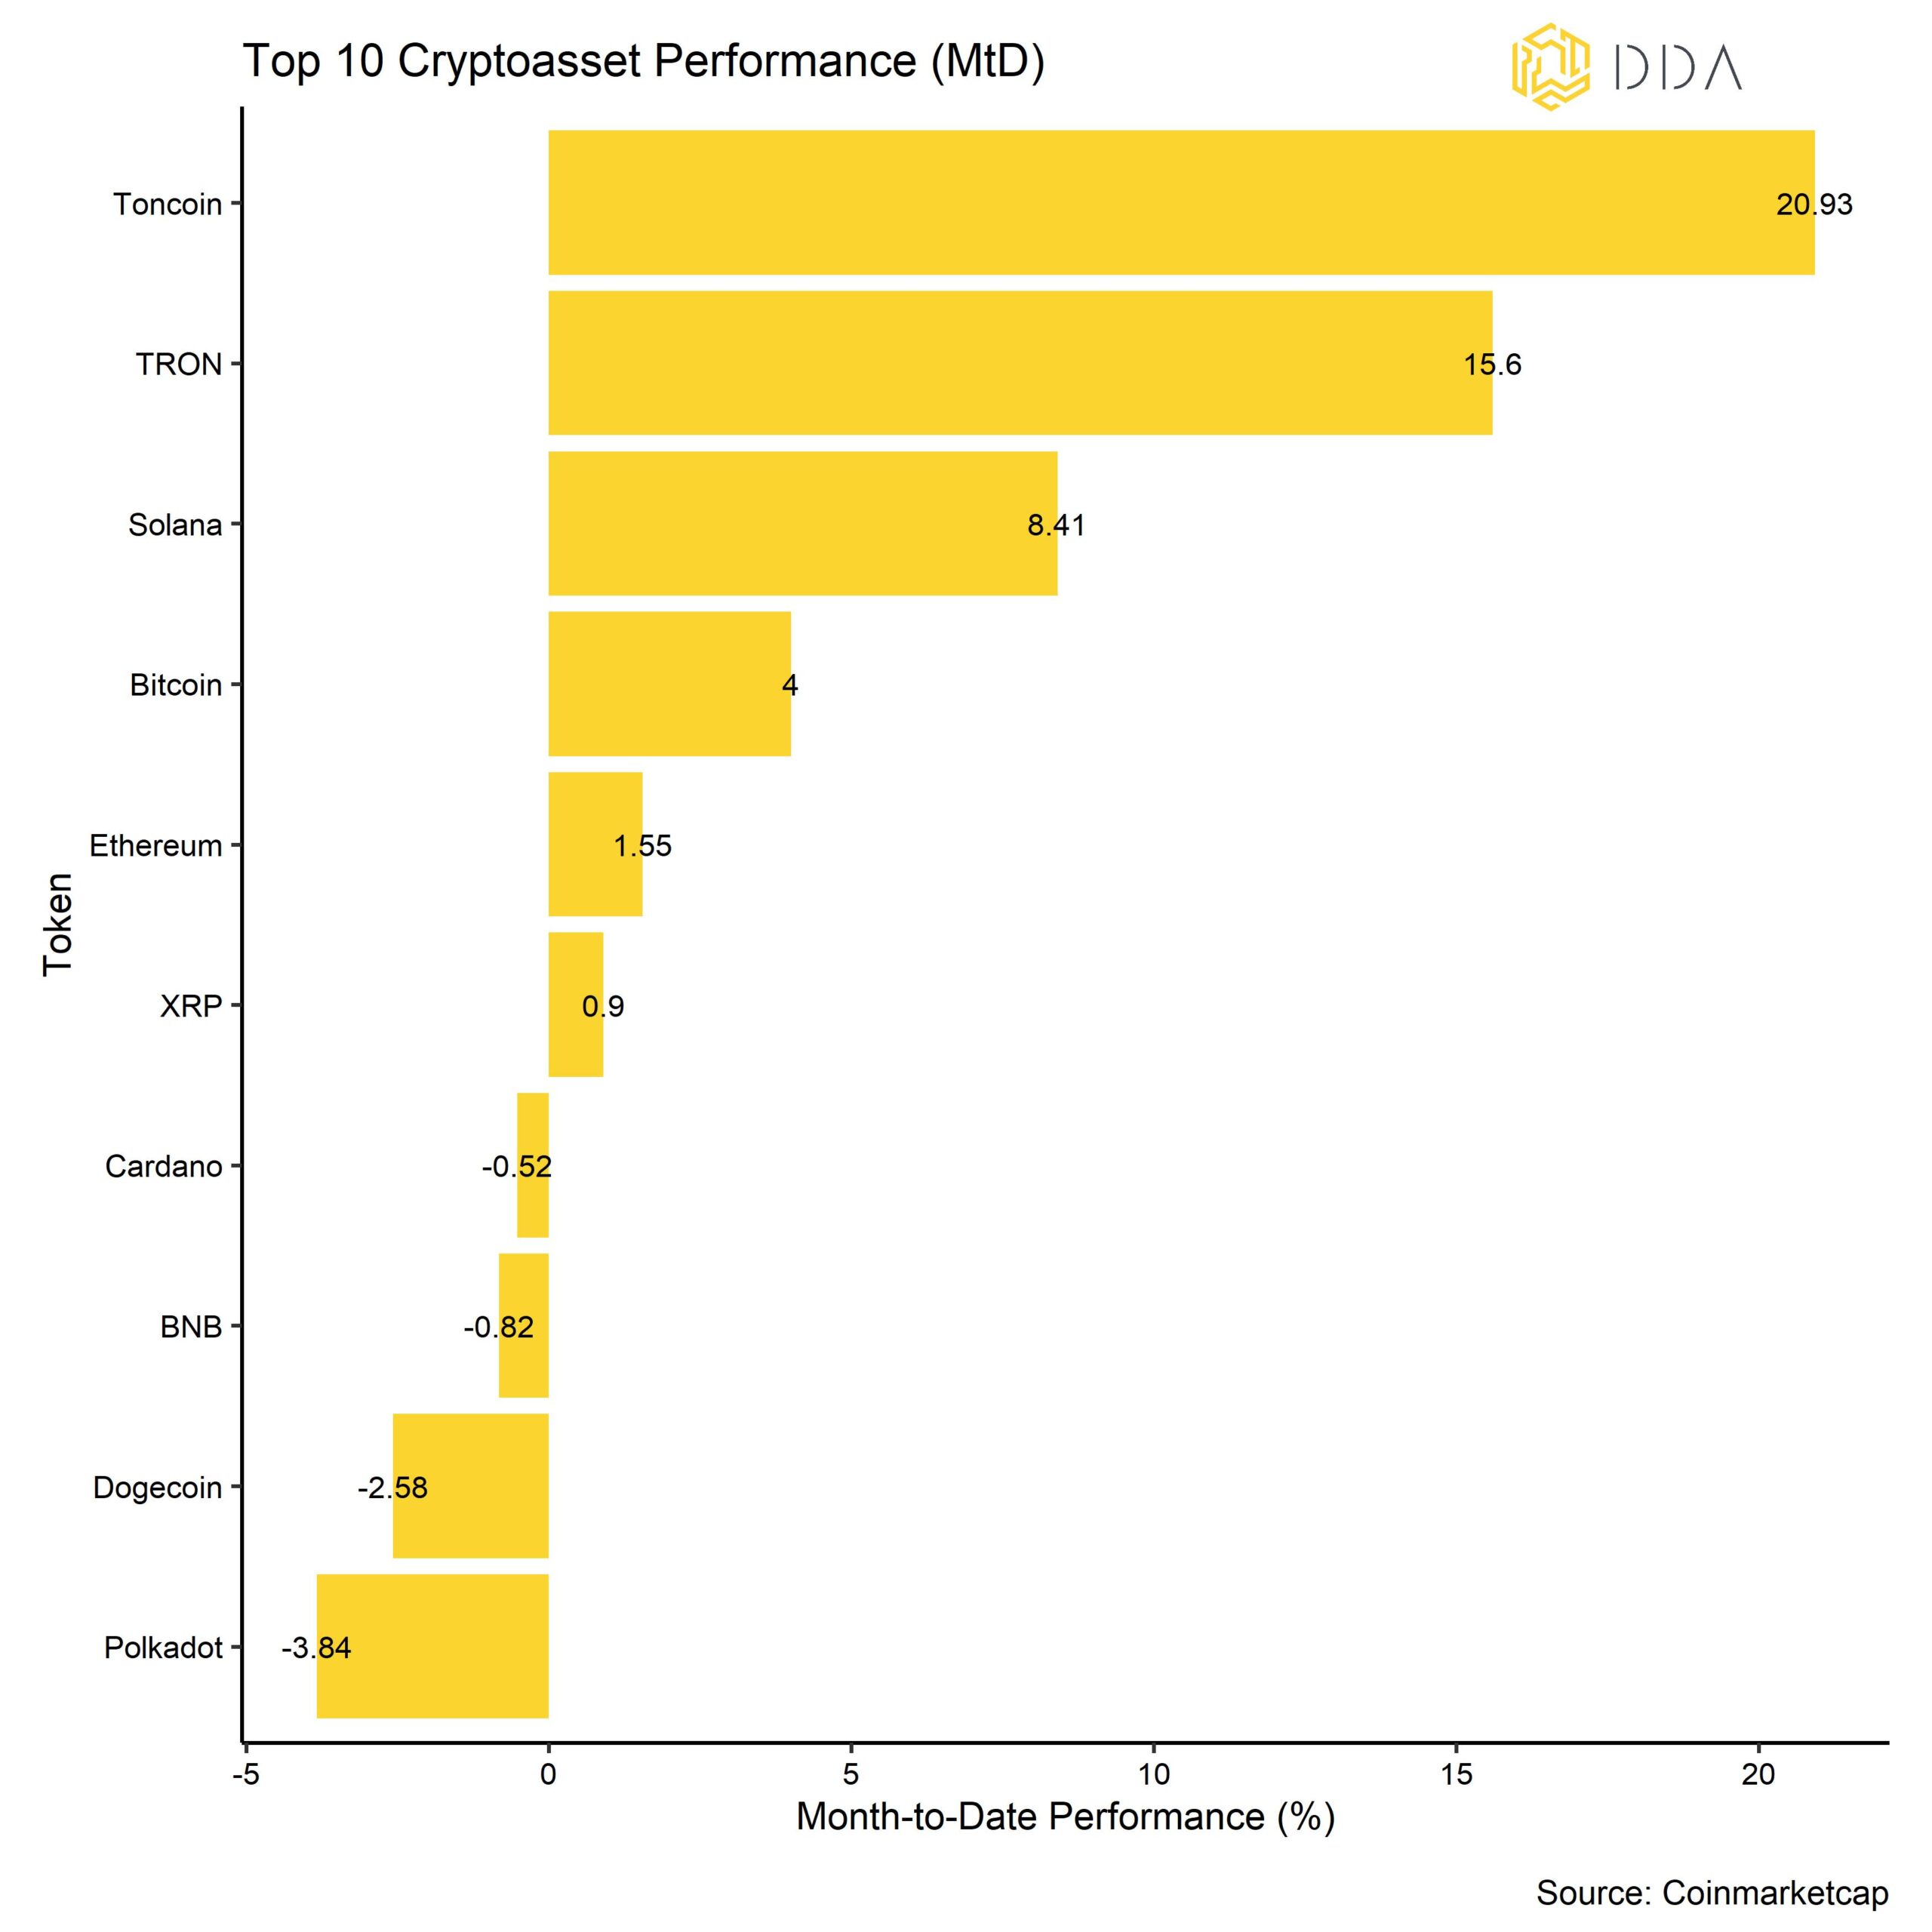
Crypto assets outperformed traditional assets in September as tighter US monetary policy affected all kinds of markets negatively. Traditional assets took a beating as the Fed reiterated its stance to keep interest rates “higher for longer”. A general tightening in US financial conditions led to a significant appreciation of the US Dollar during September.
Despite these negative performances in traditional financial markets, crypto assets held up quite well amid strong growth in network fundamentals. However, most of these performances were made at the end of the month.
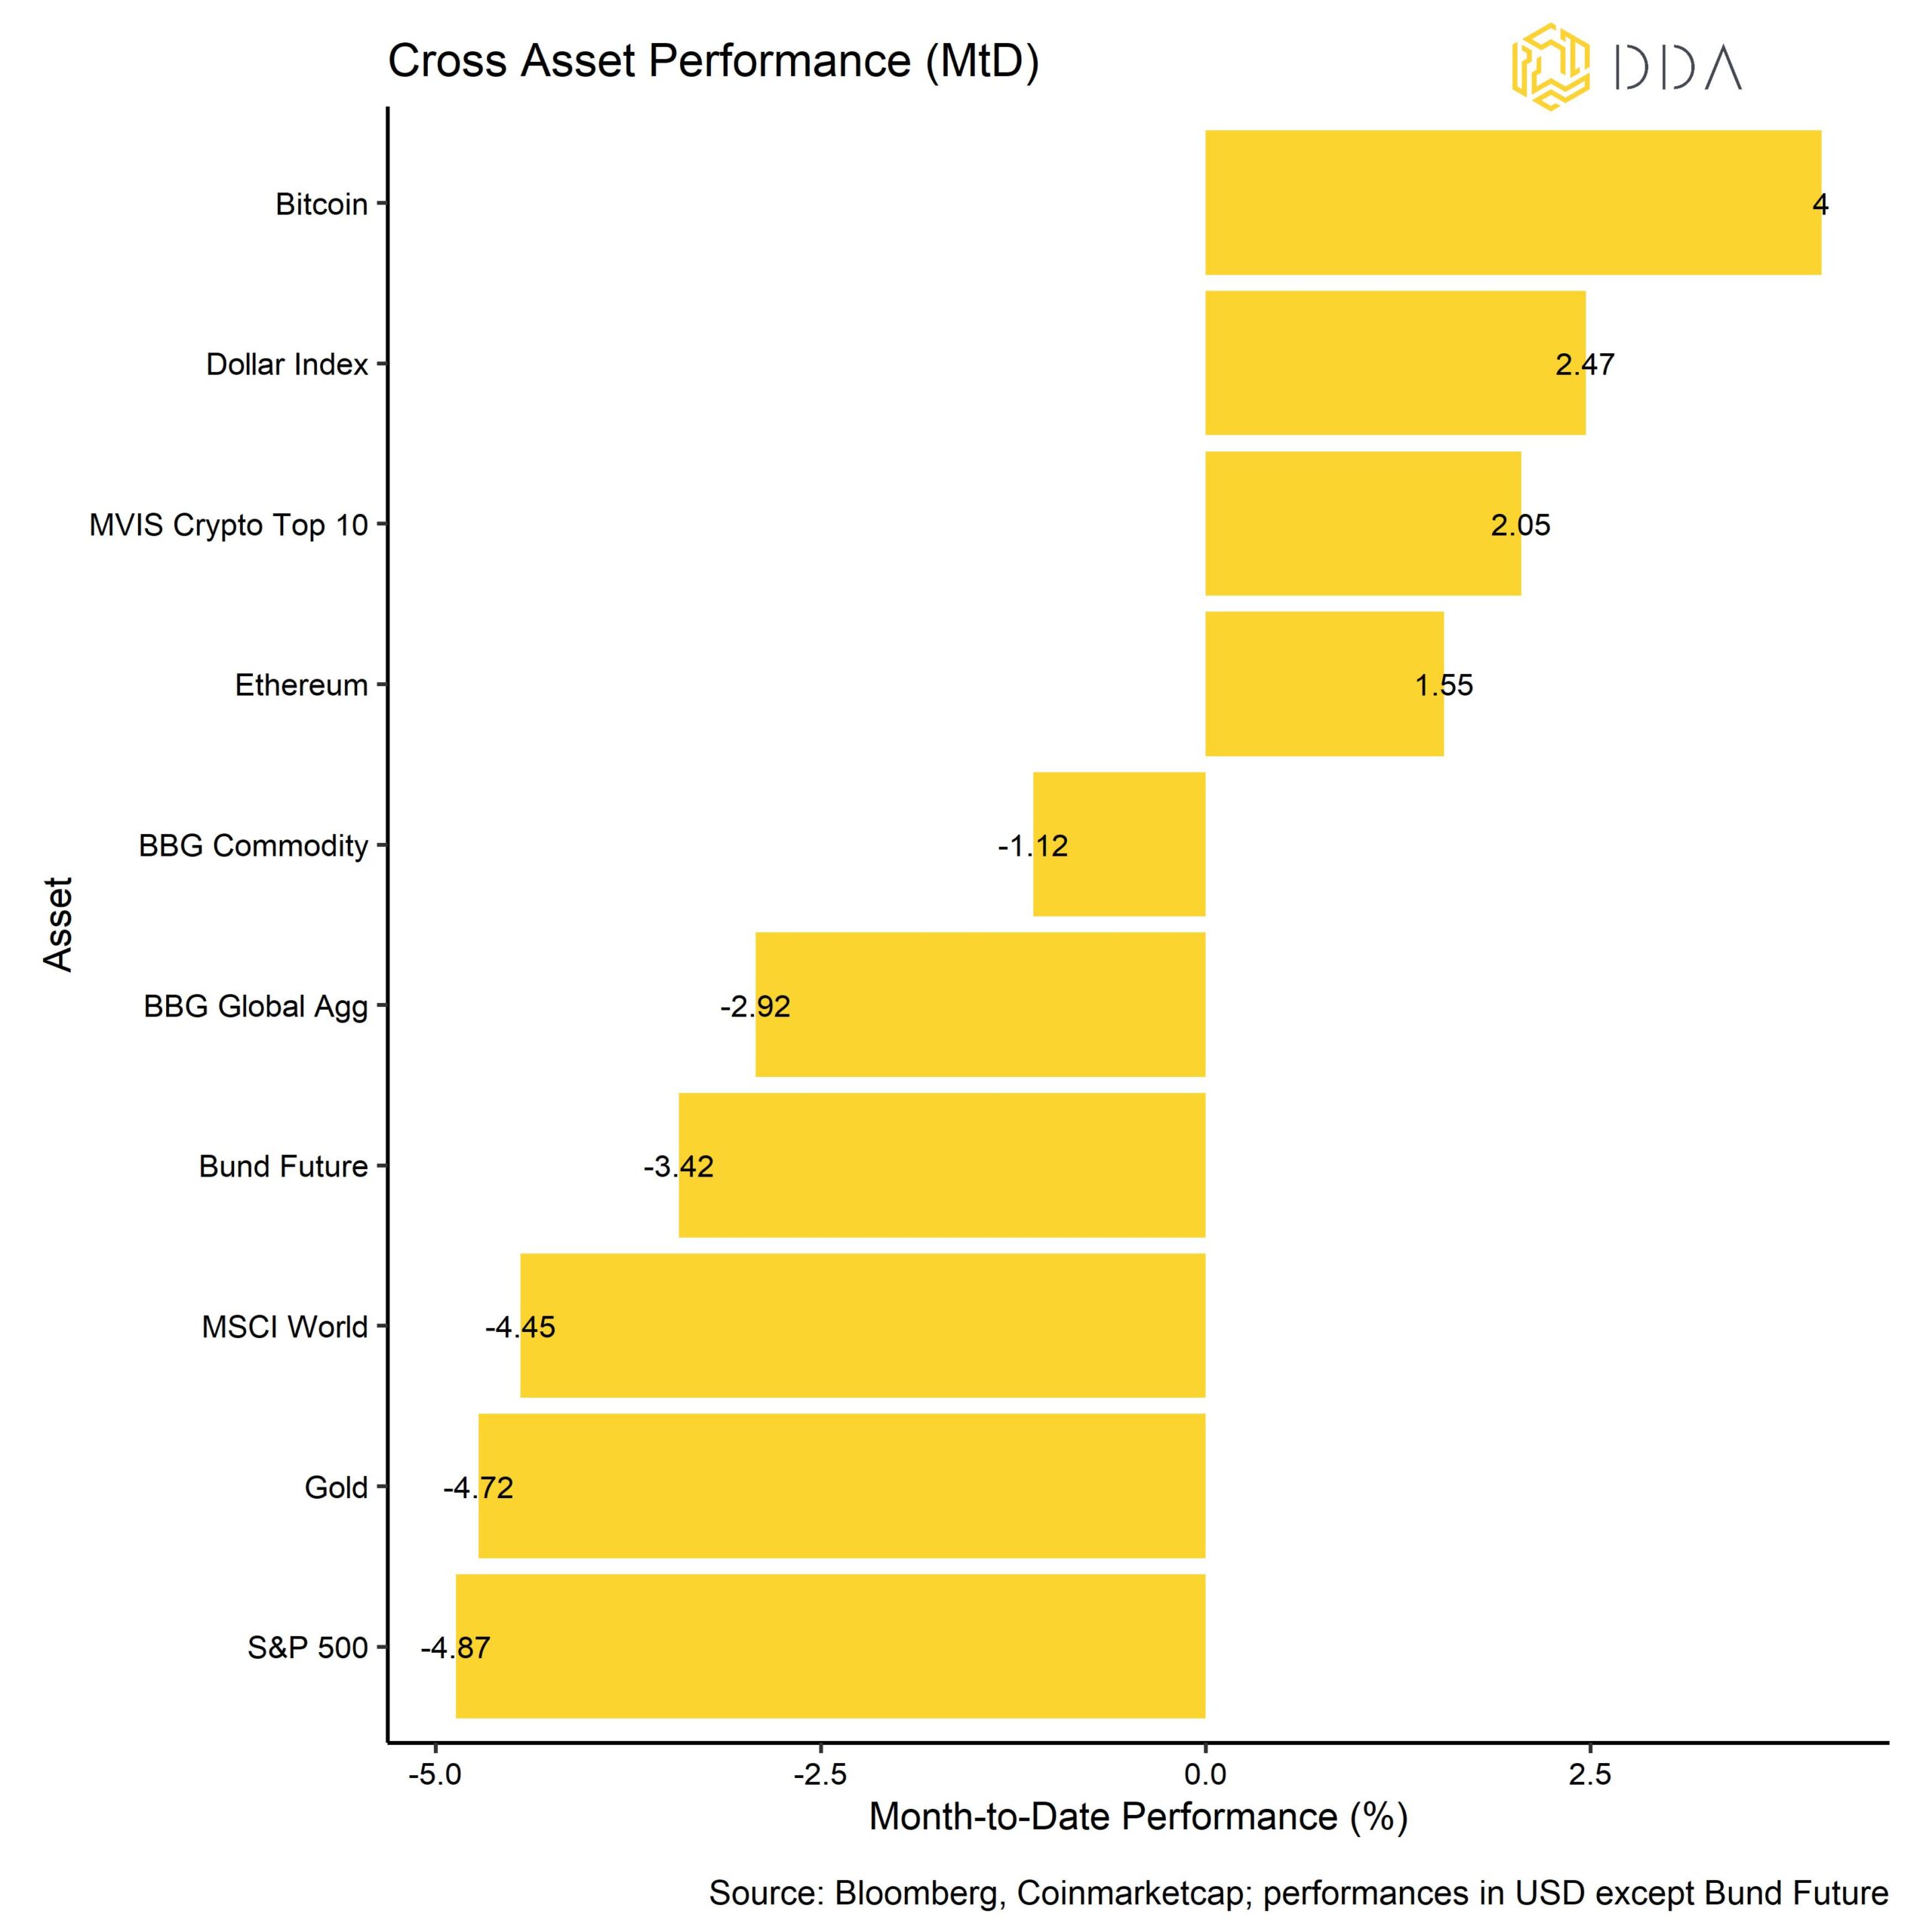
Therefore, our own DDA ETPs that are traded on regulated exchanges during normal working hours do not reflect this positive performance development yet due to the weekend.
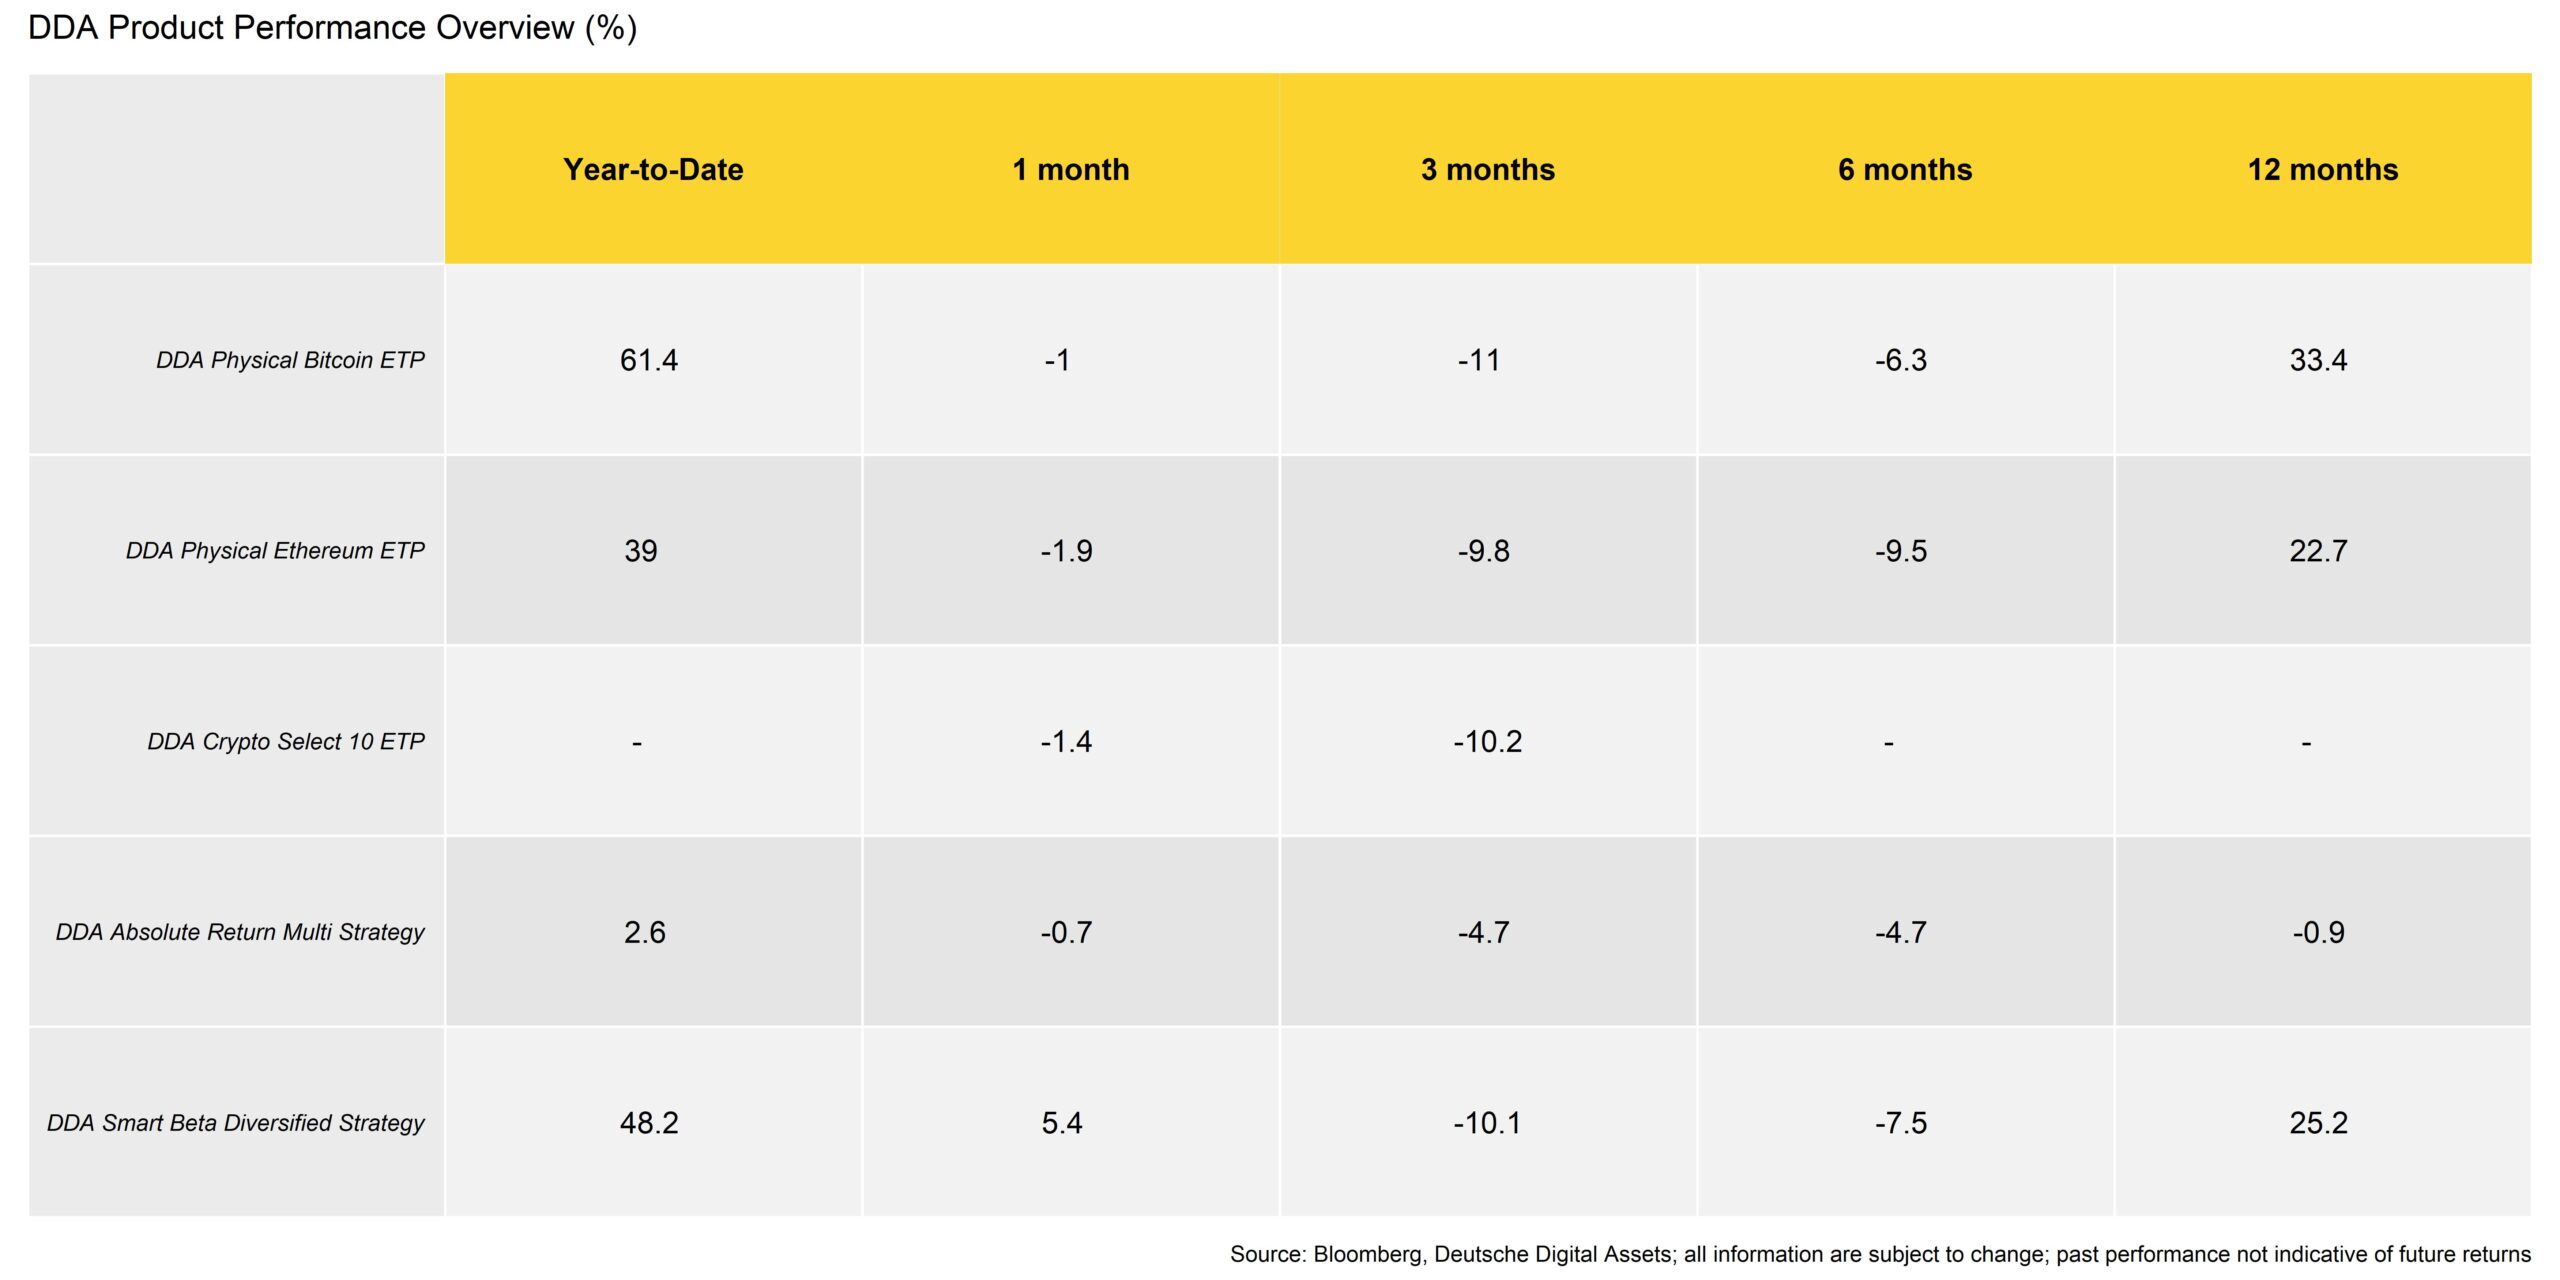
As far as the active DDA quant strategies are concerned, it was a complicated month for absolute return strategies due to the lack of realised volatility, although filters quickly limited the risk. Smart beta outperformed its benchmark by allocating to stable coins then capturing some momentum in altcoins.
In general, among the top 10 major cryptoassets, Toncoin, TRON, and Solana have been the main outperformers. Toncoin was able to outperform significantly as the social messaging service Telegram has announced to introduce a crypto wallet on Toncoin. TRON was able to outperform on account of a strong growth in Total-Value-Locked (TVL) in its network and Solana was buoyed by Visa’s announcement earlier in September to issue the USDC stablecoin on Solana.
The month of October looks more promising for crypto assets as we are entering a positive seasonality for Bitcoin in Q4. Both October and November have historically shown particularly strong performances for Bitcoin in the past (see report hier).Bottom Line: Crypto assets outperformed traditional assets in September as tighter US monetary policy affected all kinds of markets negatively while strong network fundamental growth supported major crypto assets like Bitcoin. October looks promising from a seasonality perspective.
Macro & Markets Commentary
Probably the most important macro catalyst in the last month was the FOMC meeting on the 19th/20th September. Although the FOMC decided to leave the Fed Funds Rate unchanged, Jay Powell’s rhetoric reiterated the Fed’s stance that interest rates will likely remain “higher for longer”. This has led to a general darkening in overall financial market sentiment with a major correction in equities. Interestingly, crypto assets such as Bitcoin have outperformed during the latest sell-off in equities. Nonetheless, based on our calculations, tight monetary policy continues to be a headwind for cryptoassets as well. The following chart shows the stance of monetary policy as priced by TradFi markets including equities, bonds, commodities, FX and derivatives versus Bitcoin.
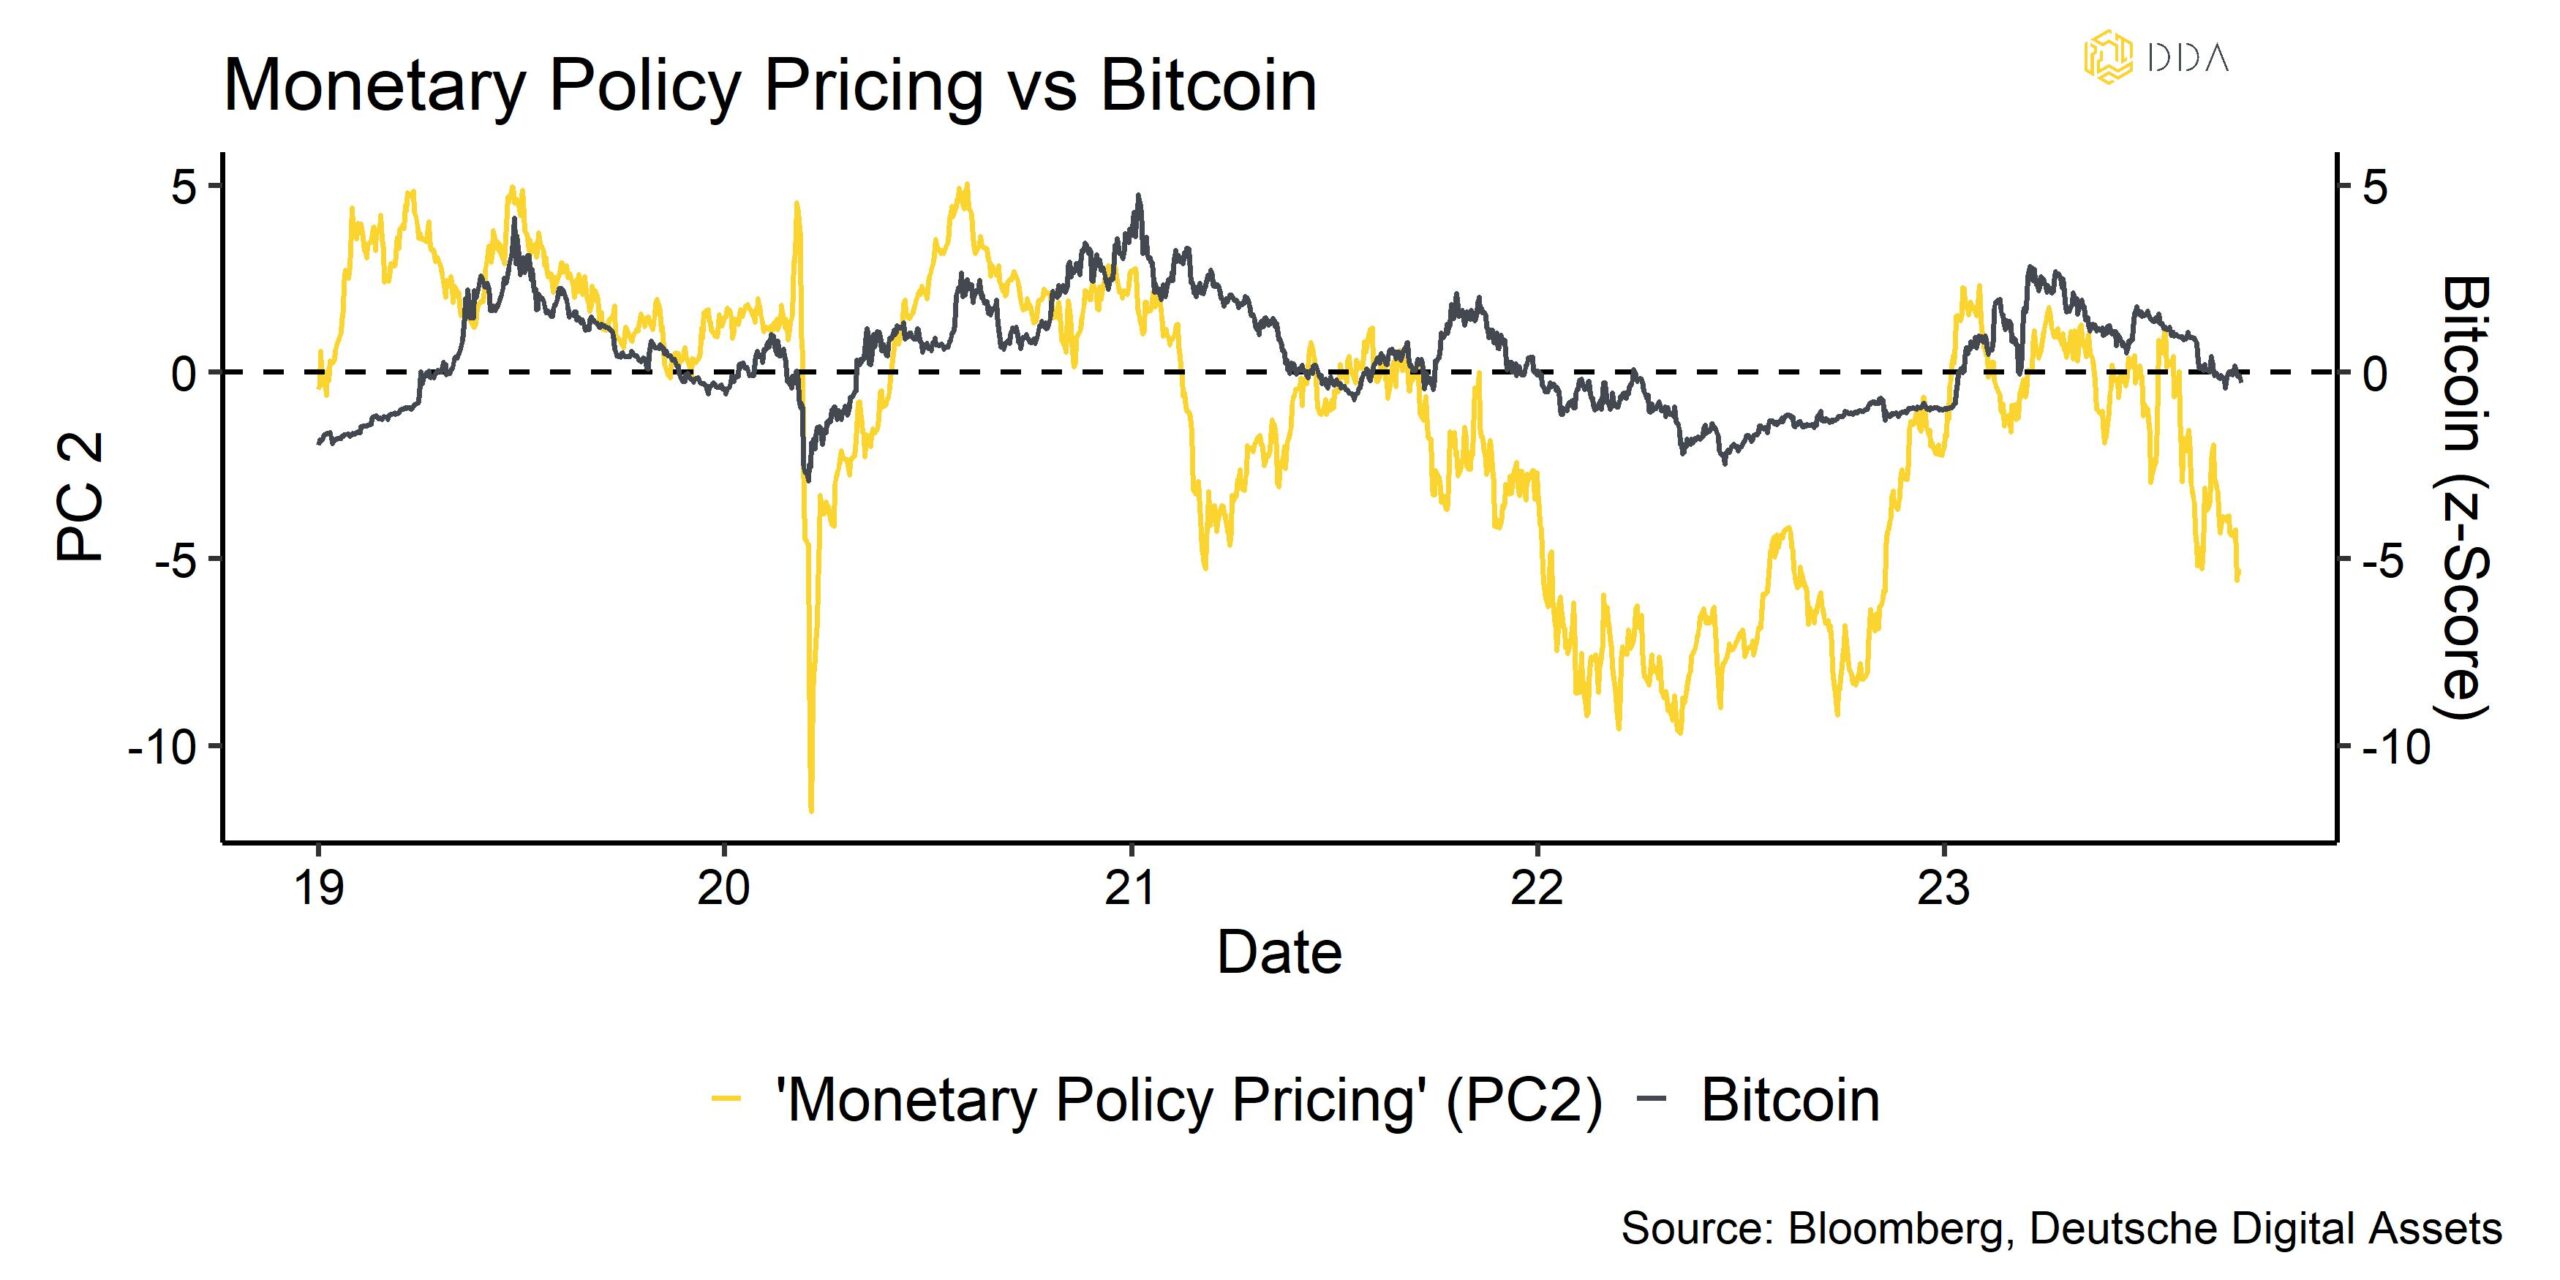
This monetary policy pricing indicator signals that monetary policy has become as tight as at the beginning of 2022.
In fact, nominal 10-year US Treasury yields have climbed to the highest level since 2007. More importantly, real US 10-year yields – a real-time proxy for the degree of monetary policy tightening – have also climbed to new multi-year highs as well (highest since 2008).
Based on US interest rate futures, markets are expecting a peak in the Fed Funds Rate in January 2024 with an implied terminal rate of around 5.4%. Thereafter, the market expects 3 cuts for the remainder of 2024. This is also still reflected in the US term structure of interest rates that is still inverted: At the time of writing, the 2s10s US Treasury term spread is still at -55 bps despite having steepened lately.
In spite of the the recent coverage of a “soft landing” scenario, economists surveyed by Bloomberg still point to a 100% recession probability over the next 12 months. This is also largely consistent with the probability of recession that is signalled by the US yield curve. The NY Fed’s model estimates a probability of 60.8% over the next 12 months.
Admittedly, recent US labour market data such as non-farm payrolls were surprisingly robust and above consensus which has bolstered the “soft landing” camp. Nonetheless, the 1st releases conceal the fact that subsequent revisions over the past 7 months have all been to the downside which has never happened outside of recessions.
Moreover, there has been an increase in the U3 unemployment rate recently which also points into that direction. Empirically, there is usually a lead in employment data of cyclical sectors before non-cyclical sectors/services start to reduce head count.
Cyclical sectors are also the most interest rate sensitive ones as the underlying outputs usually require some sort of external financing. Most notably, housing, cars, and durable goods are the most affected by changes in interest rates. These should also be the most affected by the current tightening in monetary policy.
In fact, we have already seen that US employment in residential construction, durable goods, and manufacturing has started to flatten out. Investors should focus on these employment sectors for earlier signs of weakness in the US labour market.
We also expect an increase in overall US unemployment to be a major potential catalyst for a final reversal in US monetary policy which would be a very significant tailwind for Bitcoin and crypto assets from a macro point of view.
Empirically speaking, there is a tight relationship between the US U3 unemployment rate and the steepness of the US yield curve. A sharp increase in unemployment is historically associated with a steepening of the yield curve as the Fed starts cutting rates. This consistent pattern is likely to repeat itself in the next US recession.
Other potential catalysts that could result in a reversal of monetary policy that we are watching right now:
- CPI inflation turning negative
- Increase in geopolitical risks (China vs. Taiwan)
- Resurfacing of risks within the US financial system
On the first point, we still think that there is a high probability of deflation (i.e. negative inflation rates) over the coming 12 months as broad money supply growth in the US is deeply negative. In fact, it the most contractive since 90 years. This usually leads changes in inflation rate. Negative inflation readings would be a strong argument for the Fed to reverse its tightening policy.
Secondly, tensions between the US and China as well as China and Taiwan have continued to increase. An outright military escalation, especially with regards to the possibility of a Chinese invasion of Taiwan, would likely induce the Fed to stop its tightening policy to limit the rise of US Treasury yields in light of a significant increase in (anticipated) US fiscal spending.
Thirdly, a resurfacing of systemic risks within the financial system would potentially lead to a renewed provision of liquidity by the Fed like we have seen in March 2023 with the collapse of Silicon Valley Bank.
We think that these systemic risks are still present in the US financial system as advances by the Federal Home Loan Bank (FHLB) to financial institutions with liquidity issues are still around 658 bn USD per Q2 2023.
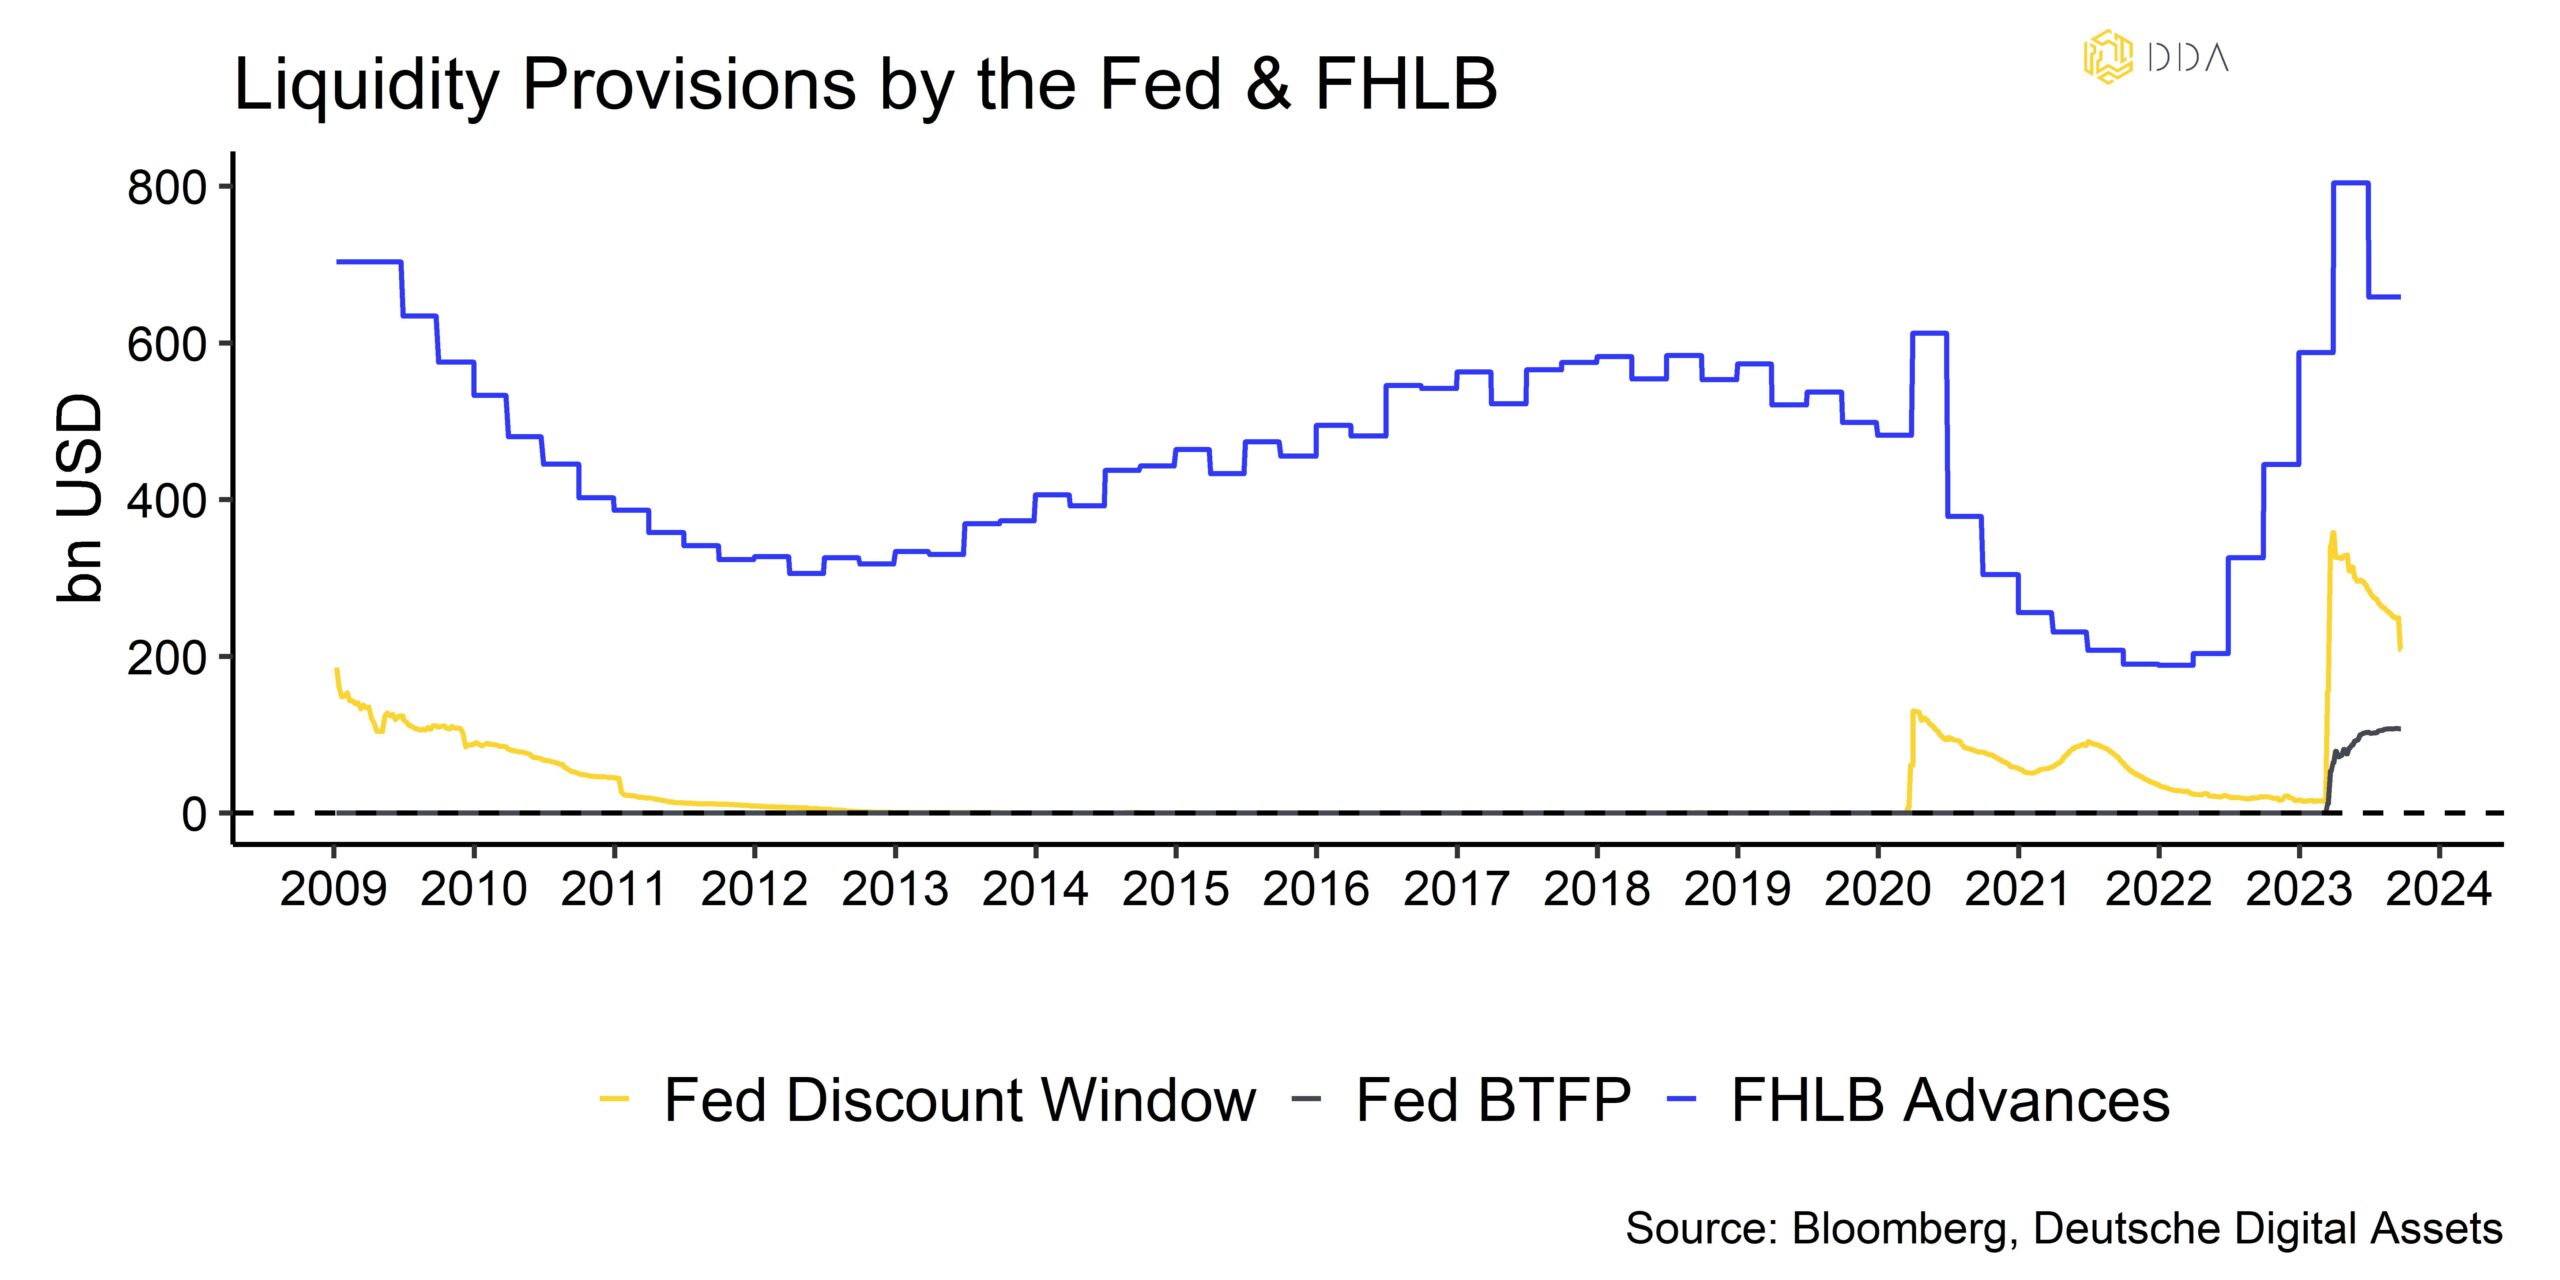
Meanwhile, extraordinary liquidity provisions via the Fed’s Discount Window have decreased while provisions via the Bank Term Funding Program (BTFP) that allows financial institutions to swap bonds below par for Fed funds at par have continued to increase.
In fact, the amount of US Treasuries alone trading below par has recently increased again with the rise in yields and is still at almost USD 1.5 trn.
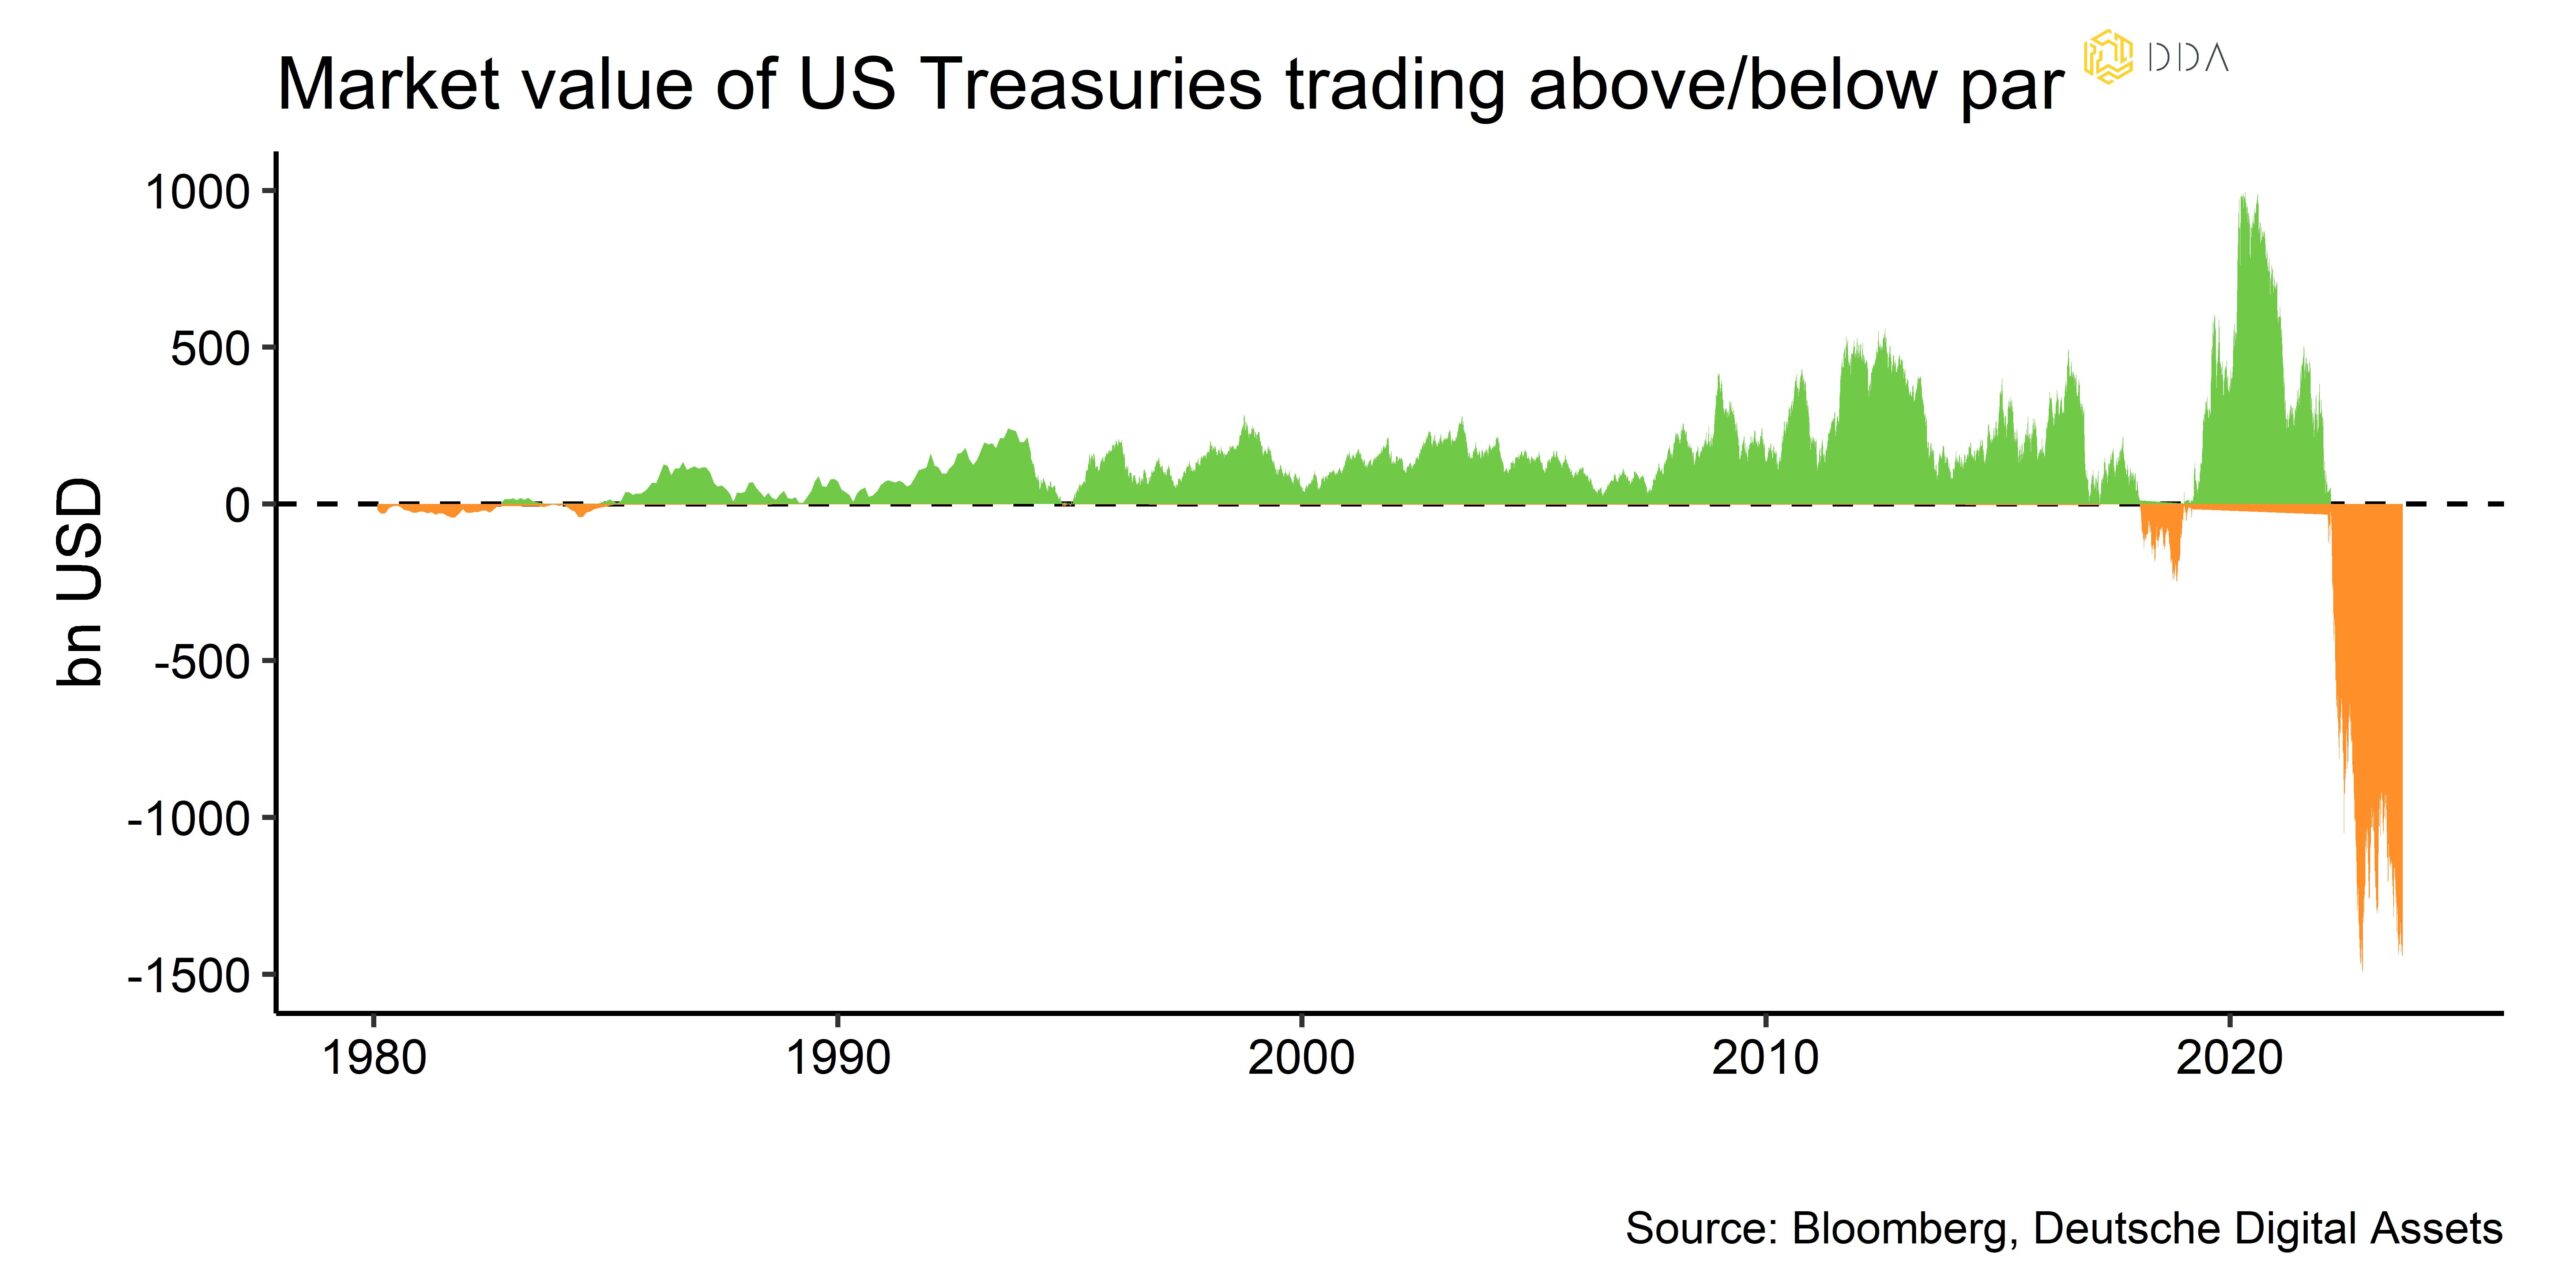
It is important to note that any additional measures by the Fed to ease the financial system’s liquidity issues is likely going to be Dollar bearish and therefore bullish for Bitcoin and crypto assets.
Bottom Line: Renewed tightening in US monetary policy continues to be a headwind for Bitcoin and crypto assets in the short term. A variety of factors could eventually lead to a reversal in US monetary policy which would be very bullish for crypto assets. These include an increase in US unemployment, negative inflation readings, increase in geopolitical risks, or resurfacing of systemic financial risks. Risks in the US financial system still abound as evidenced by the high FHLB advances and the amount of US Treasuries trading below par.
On-Chain Analytics
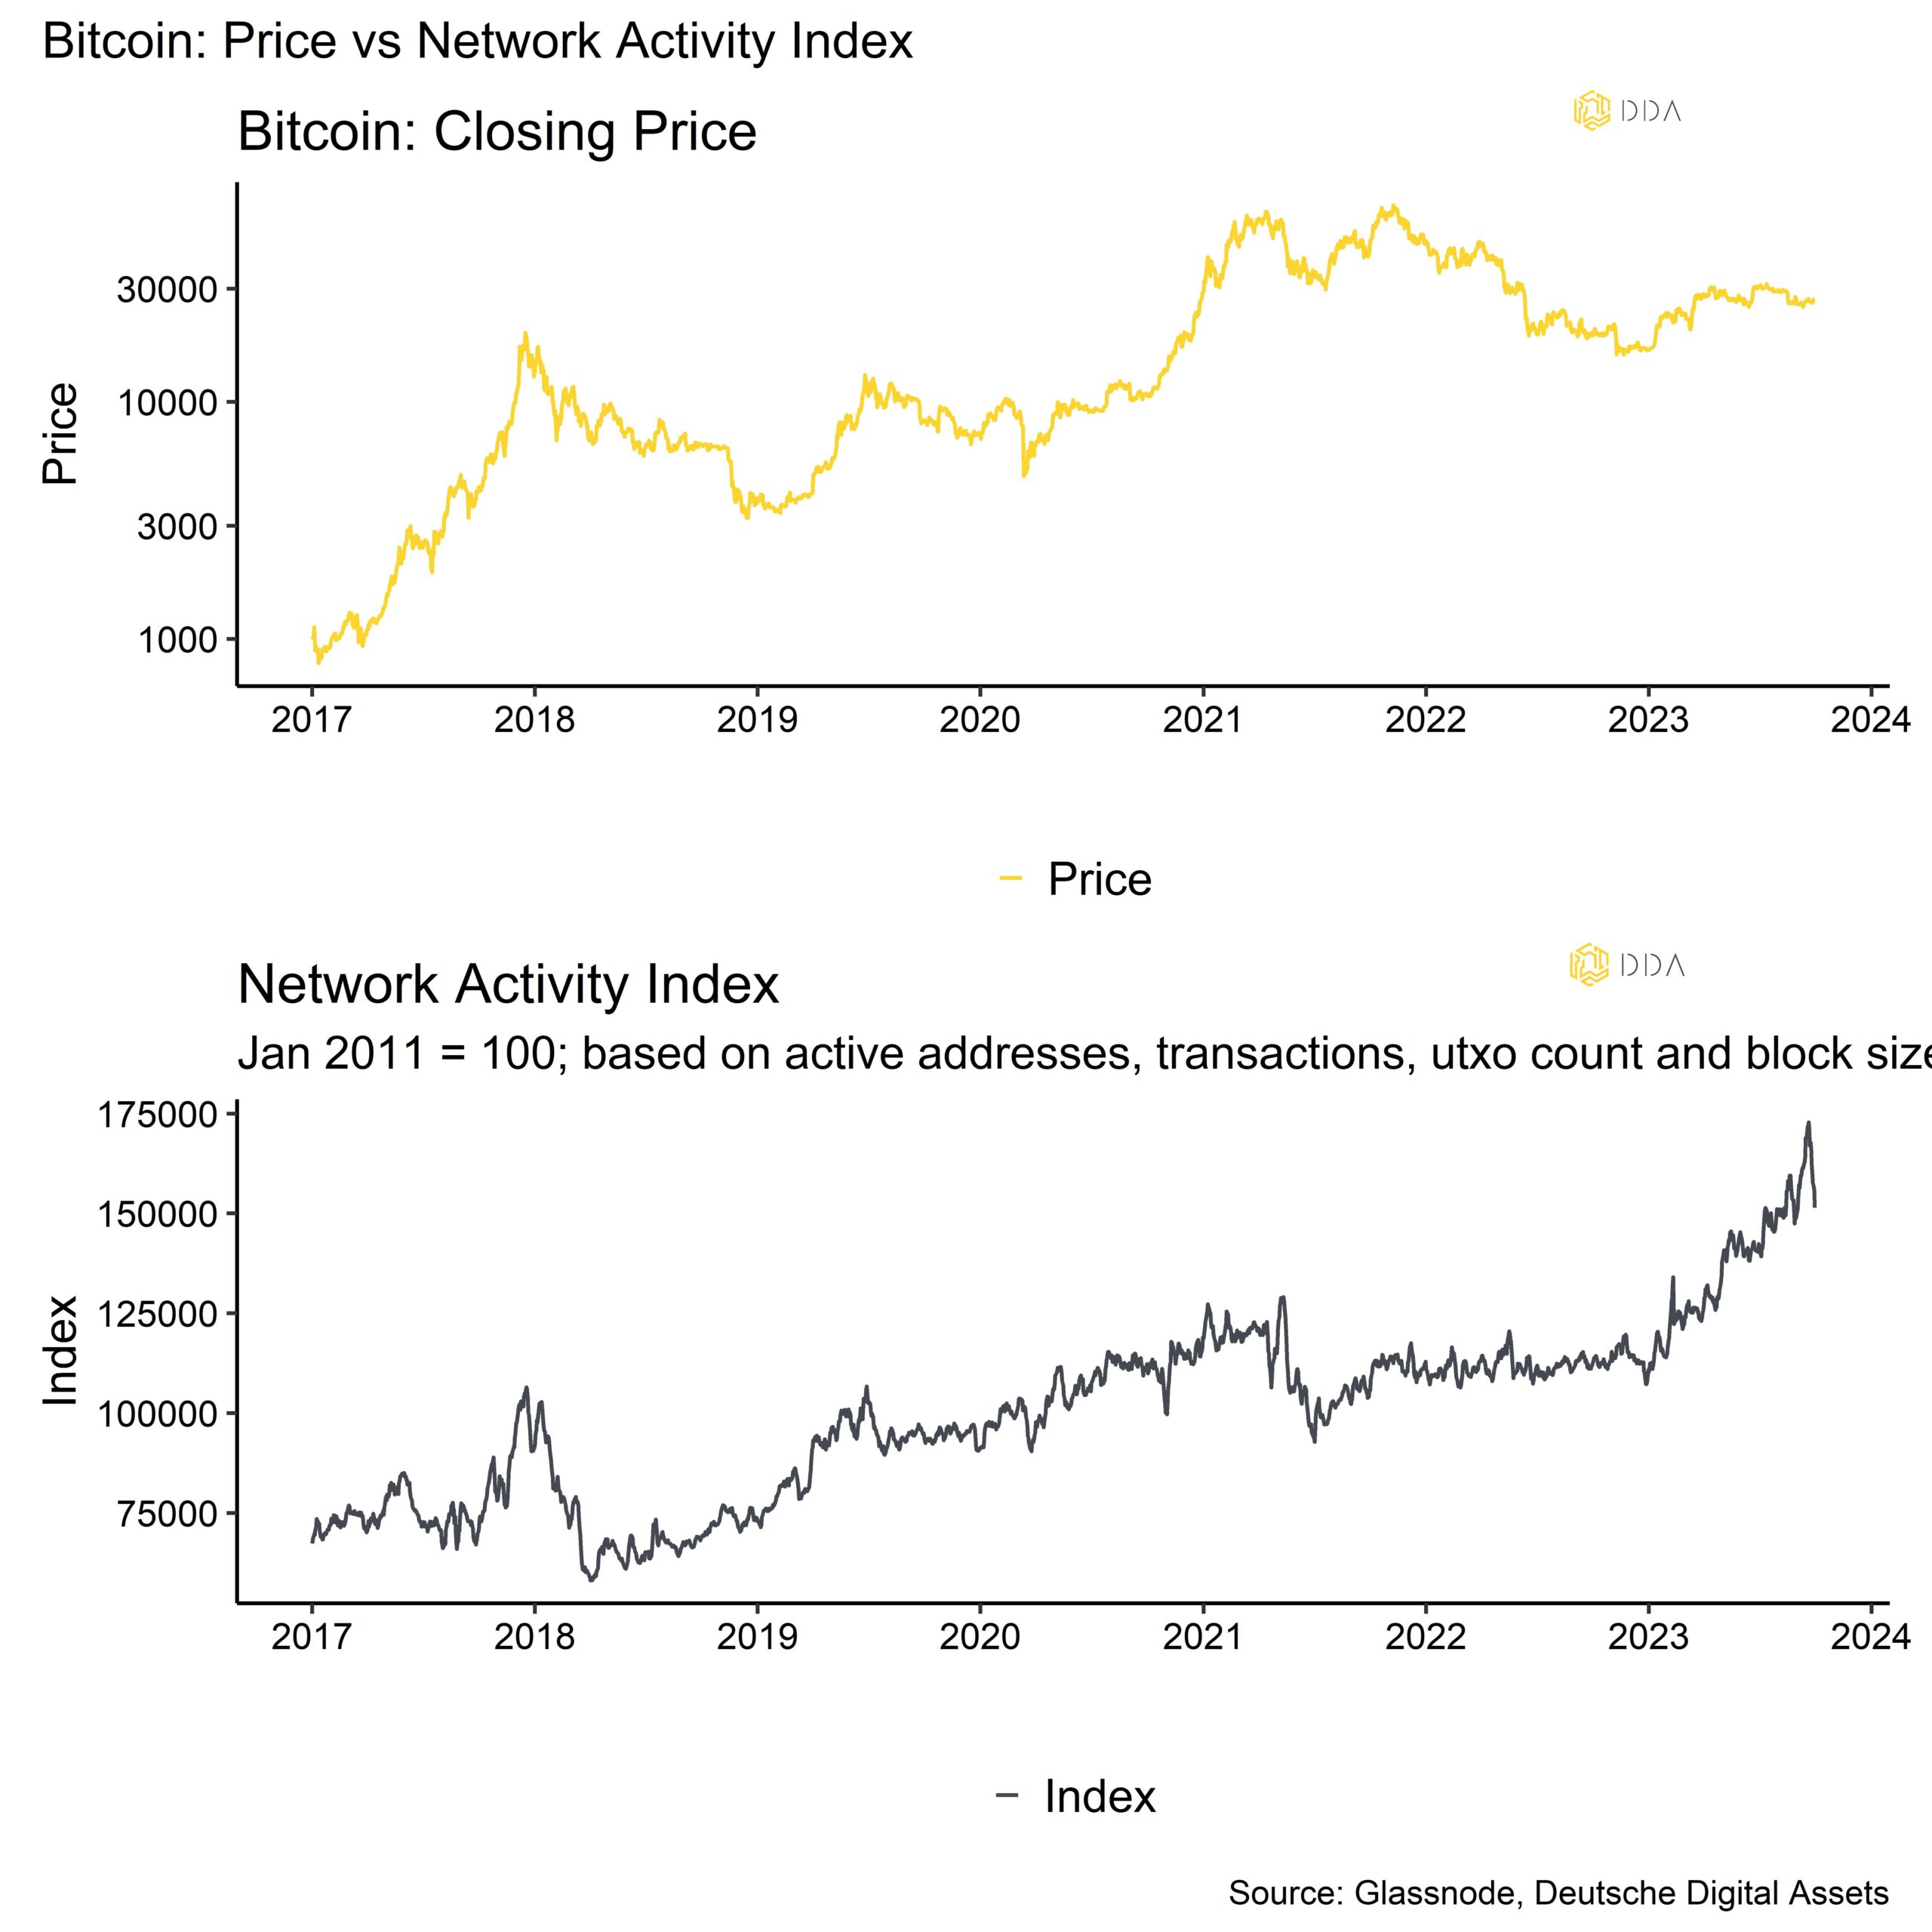
That being said, a large part of this significant increase in network activity still appears to be related to inscription demand, i.e. non-monetary transfers.
Based on data provided by Glassnode, the share inscriptions, especially text-based BRC-20 inscriptions, has averaged between 40% and 60% in September. Inscriptions have a substantial effect on the UTXO set, which is expanding quickly. The overall number of UTXOs in the set has increased by +46.2M (+33.8%) since February. This rate of weekly rise is the highest ever recorded, maintaining values of 300,000 to 450,0000 UTXOs/wk for more than six months.
The SATS BRC-20 token, which was introduced in March but whose minting just ended this week, is noteworthy. At least 21 million additional UTXOs, or about 45.5% of the growth, are attributable to this token alone. It will be interesting to watch if mempool clearing begins now that this multi-month token mint has ended.
However, the important take away for investors here is that inscriptions create a consistent demand for Bitcoin’s block space which incentivizes miners to secure the network. Before the emergence of inscriptions earlier this year, an average of between 2250 and 2500 transactions entered a typical Bitcoin block every 10 minutes. This average has increased significantly and now blocks contain on average between 2800 to 3500 transactions.
More importantly, there is little evidence that inscriptions are replacing money transfers; rather, they serve as a last-resort buyer for inexpensive blockspace.
Another important talking point among on-chain analysts was the potential effect of a final approval of a Bitcoin Spot ETF in the US on the price of Bitcoin.
The following table shows pending US Bitcoin Spot ETF applications and includes the respective issuer’s total AuM estimate:
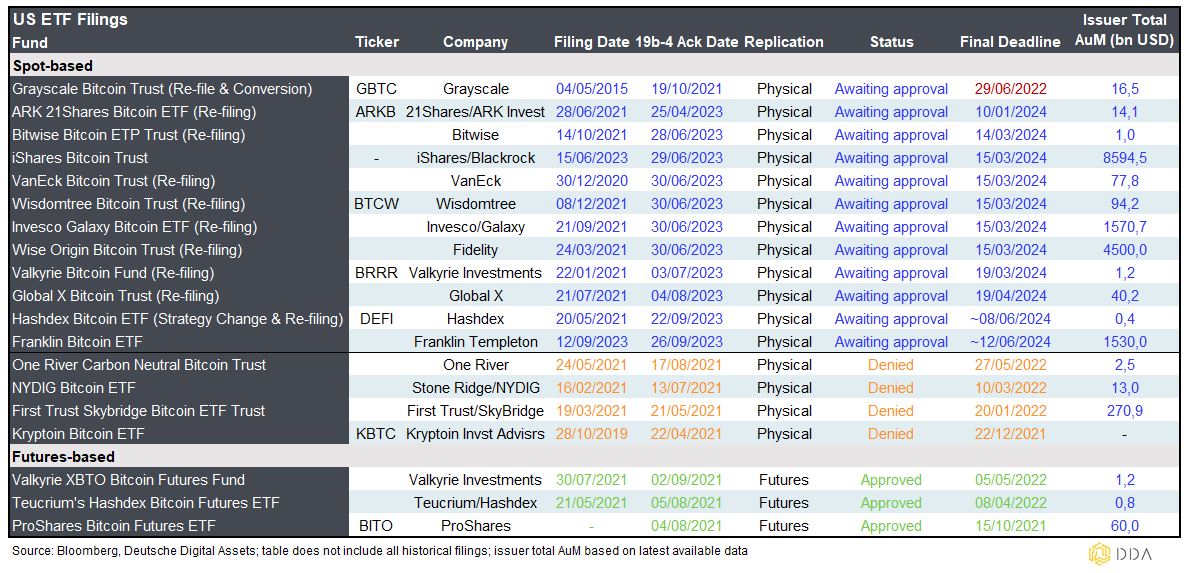
Together these asset managers manage a combined total of approximately USD 17 trn. Under the assumption that only 1% of these assets were invested into these new Bitcoin ETFs, that would amount to approximately +170 bn USD of additional capital being invested into Bitcoin.
For reference:
- The aggregate value of assets under management (AuM) in global Bitcoin ETPs currently still only amounts to USD 25.9 bn (single asset Bitcoin ETPs)
- The realized cap of Bitcoin, which is equivalent to the cost-basis of all money that was ever invested into Bitcoin on-chain, amounts to USD 395 bn
Thus, USD 170 bn would be equivalent to 650% of the current market value (AuM) of global Bitcoin ETPs or 43% of all the money ever invested into Bitcoin on-chain (realized cap).
We have recently estimated the potential price impact of the US Bitcoin Spot ETF approvals on the price of Bitcoin. Make sure to read that piece hier.
The main key takeaway from that study is that
[…] a +1% increase in Bitcoin ETP Fund Flows relative to AuMs per week was on average associated with an increase in the price of Bitcoin of 0.96%-points in that same week since 2013.
Hypothetically speaking, a +650% increase in global Bitcoin ETP AuM could result in a comparable price performance, if that money should really be invested.
Remember that investments in Bitcoin via ETPs are still comparatively small compared to on-chain investment flows and, therefore, have significant upside potential. A point we made in further detail hier.
But any investments into spot Bitcoin ETFs should logically entail an equivalent on-chain investment as these products are typically 100% physically-backed with real Bitcoin.
Another important observation to make with respect to on-chain developments was the fact that accumulation activity has started picking up into the latest price correction.
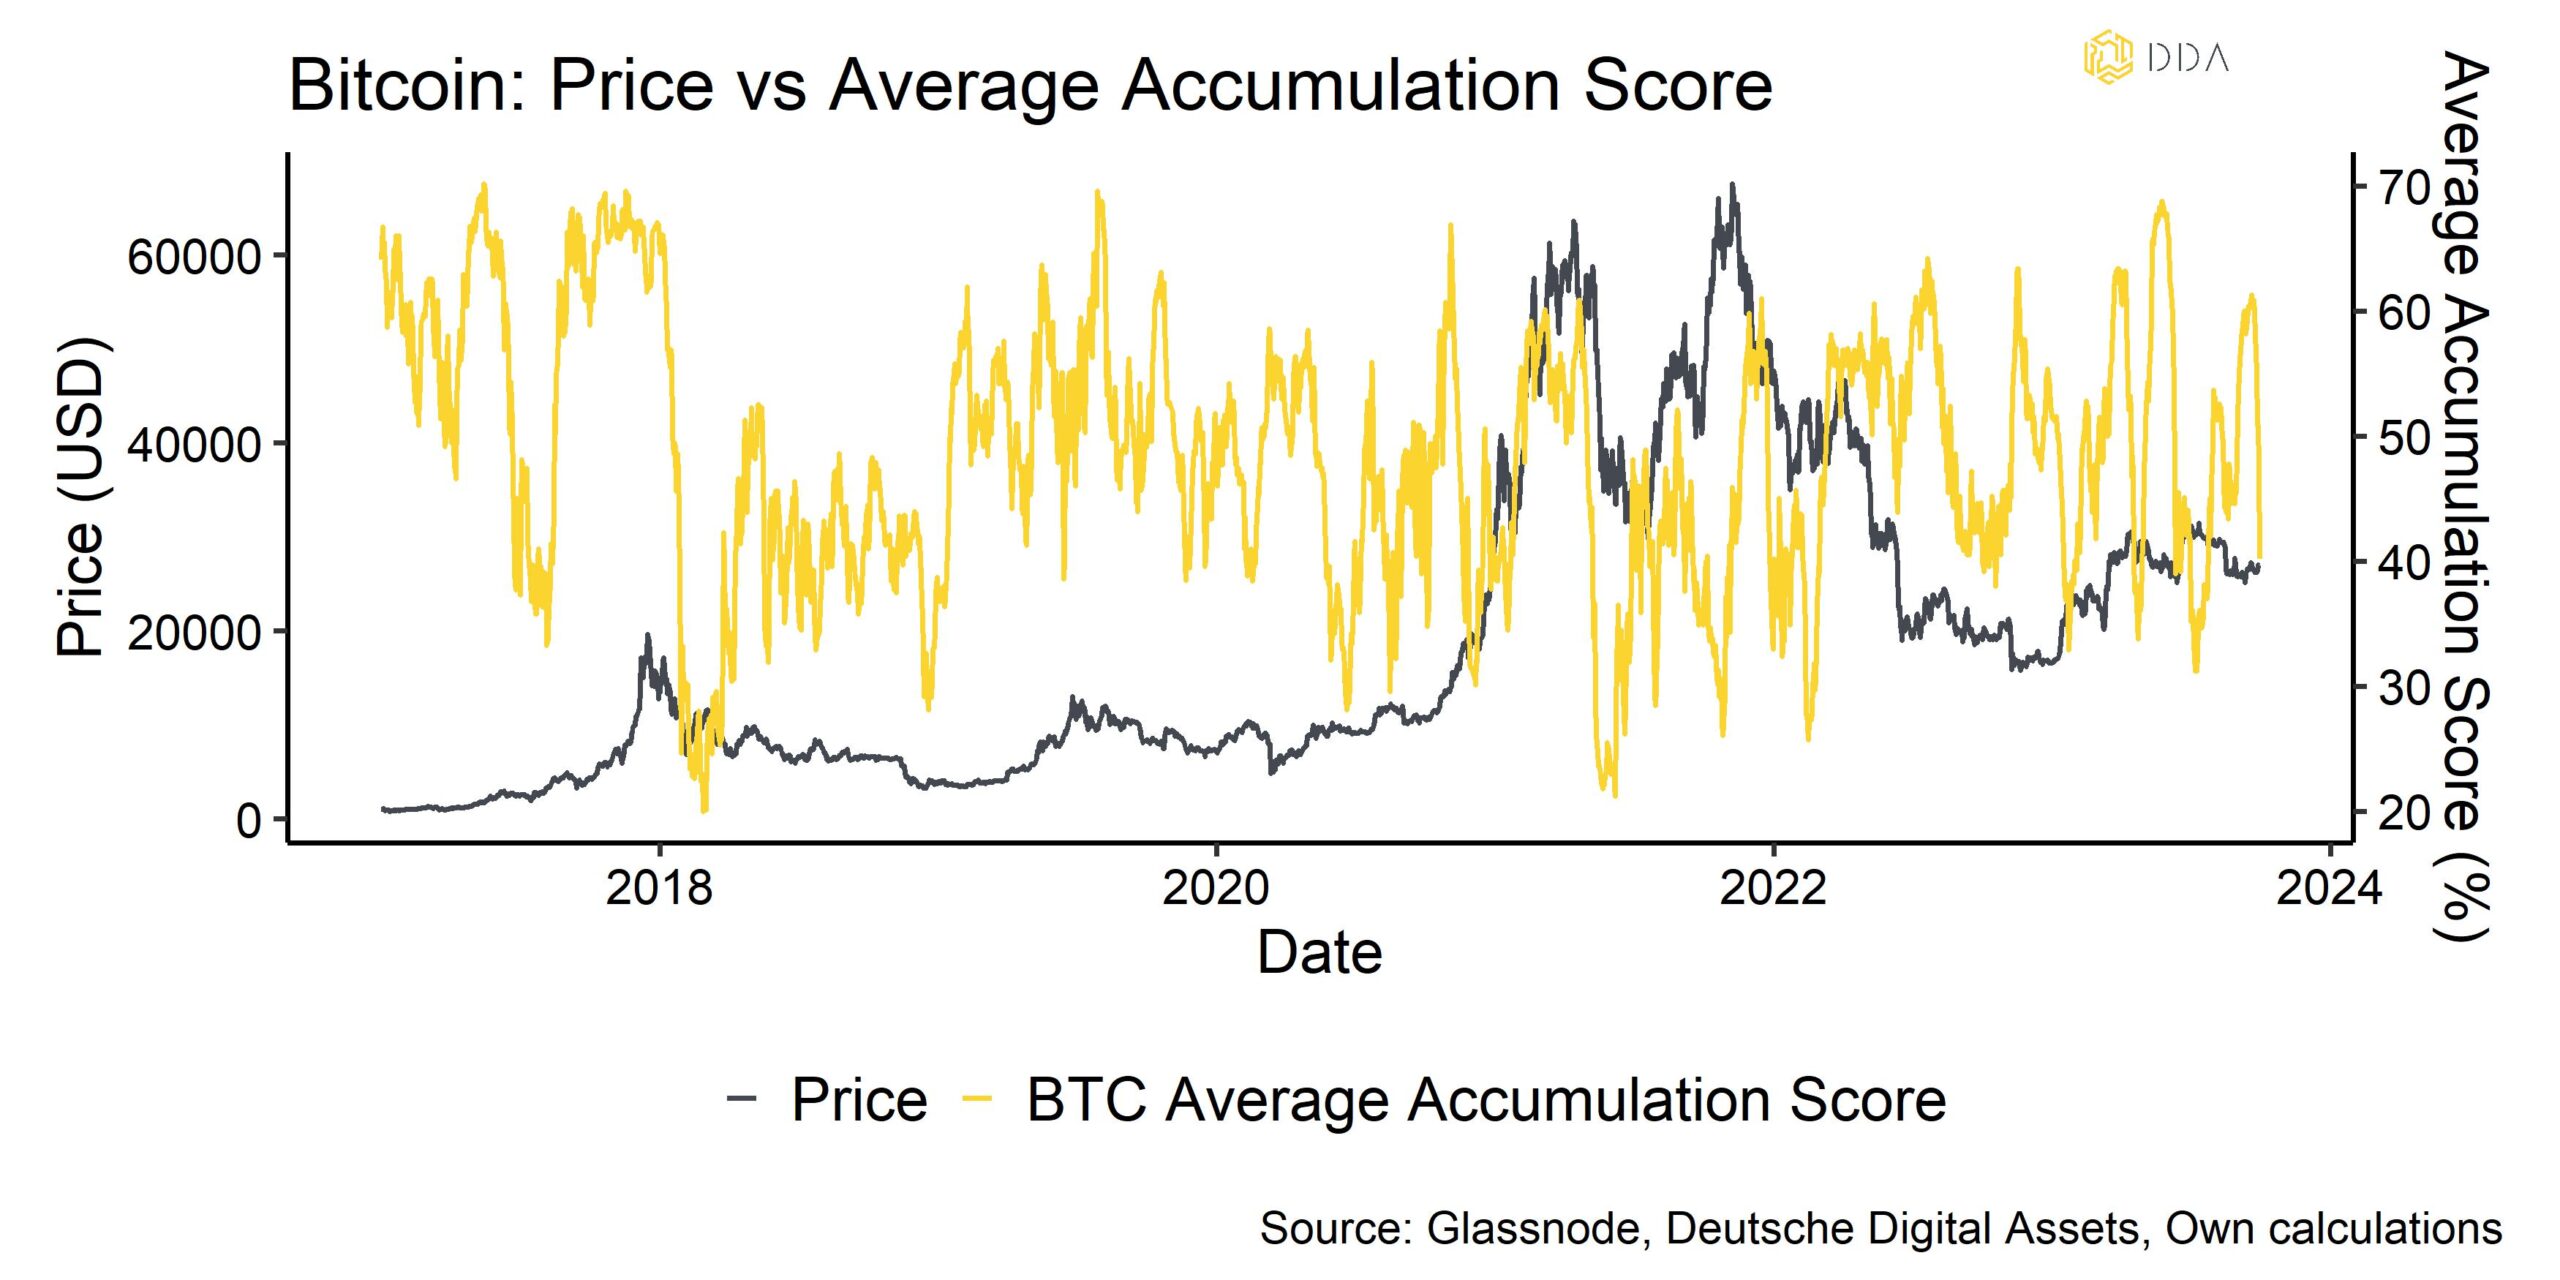
It is encouraging to see that investors have exhibited a somewhat contrarian buying behaviour in Bitcoin, increasing accumulation dynamics in price dips and vice versa. This should set a floor under any further downside price movements.
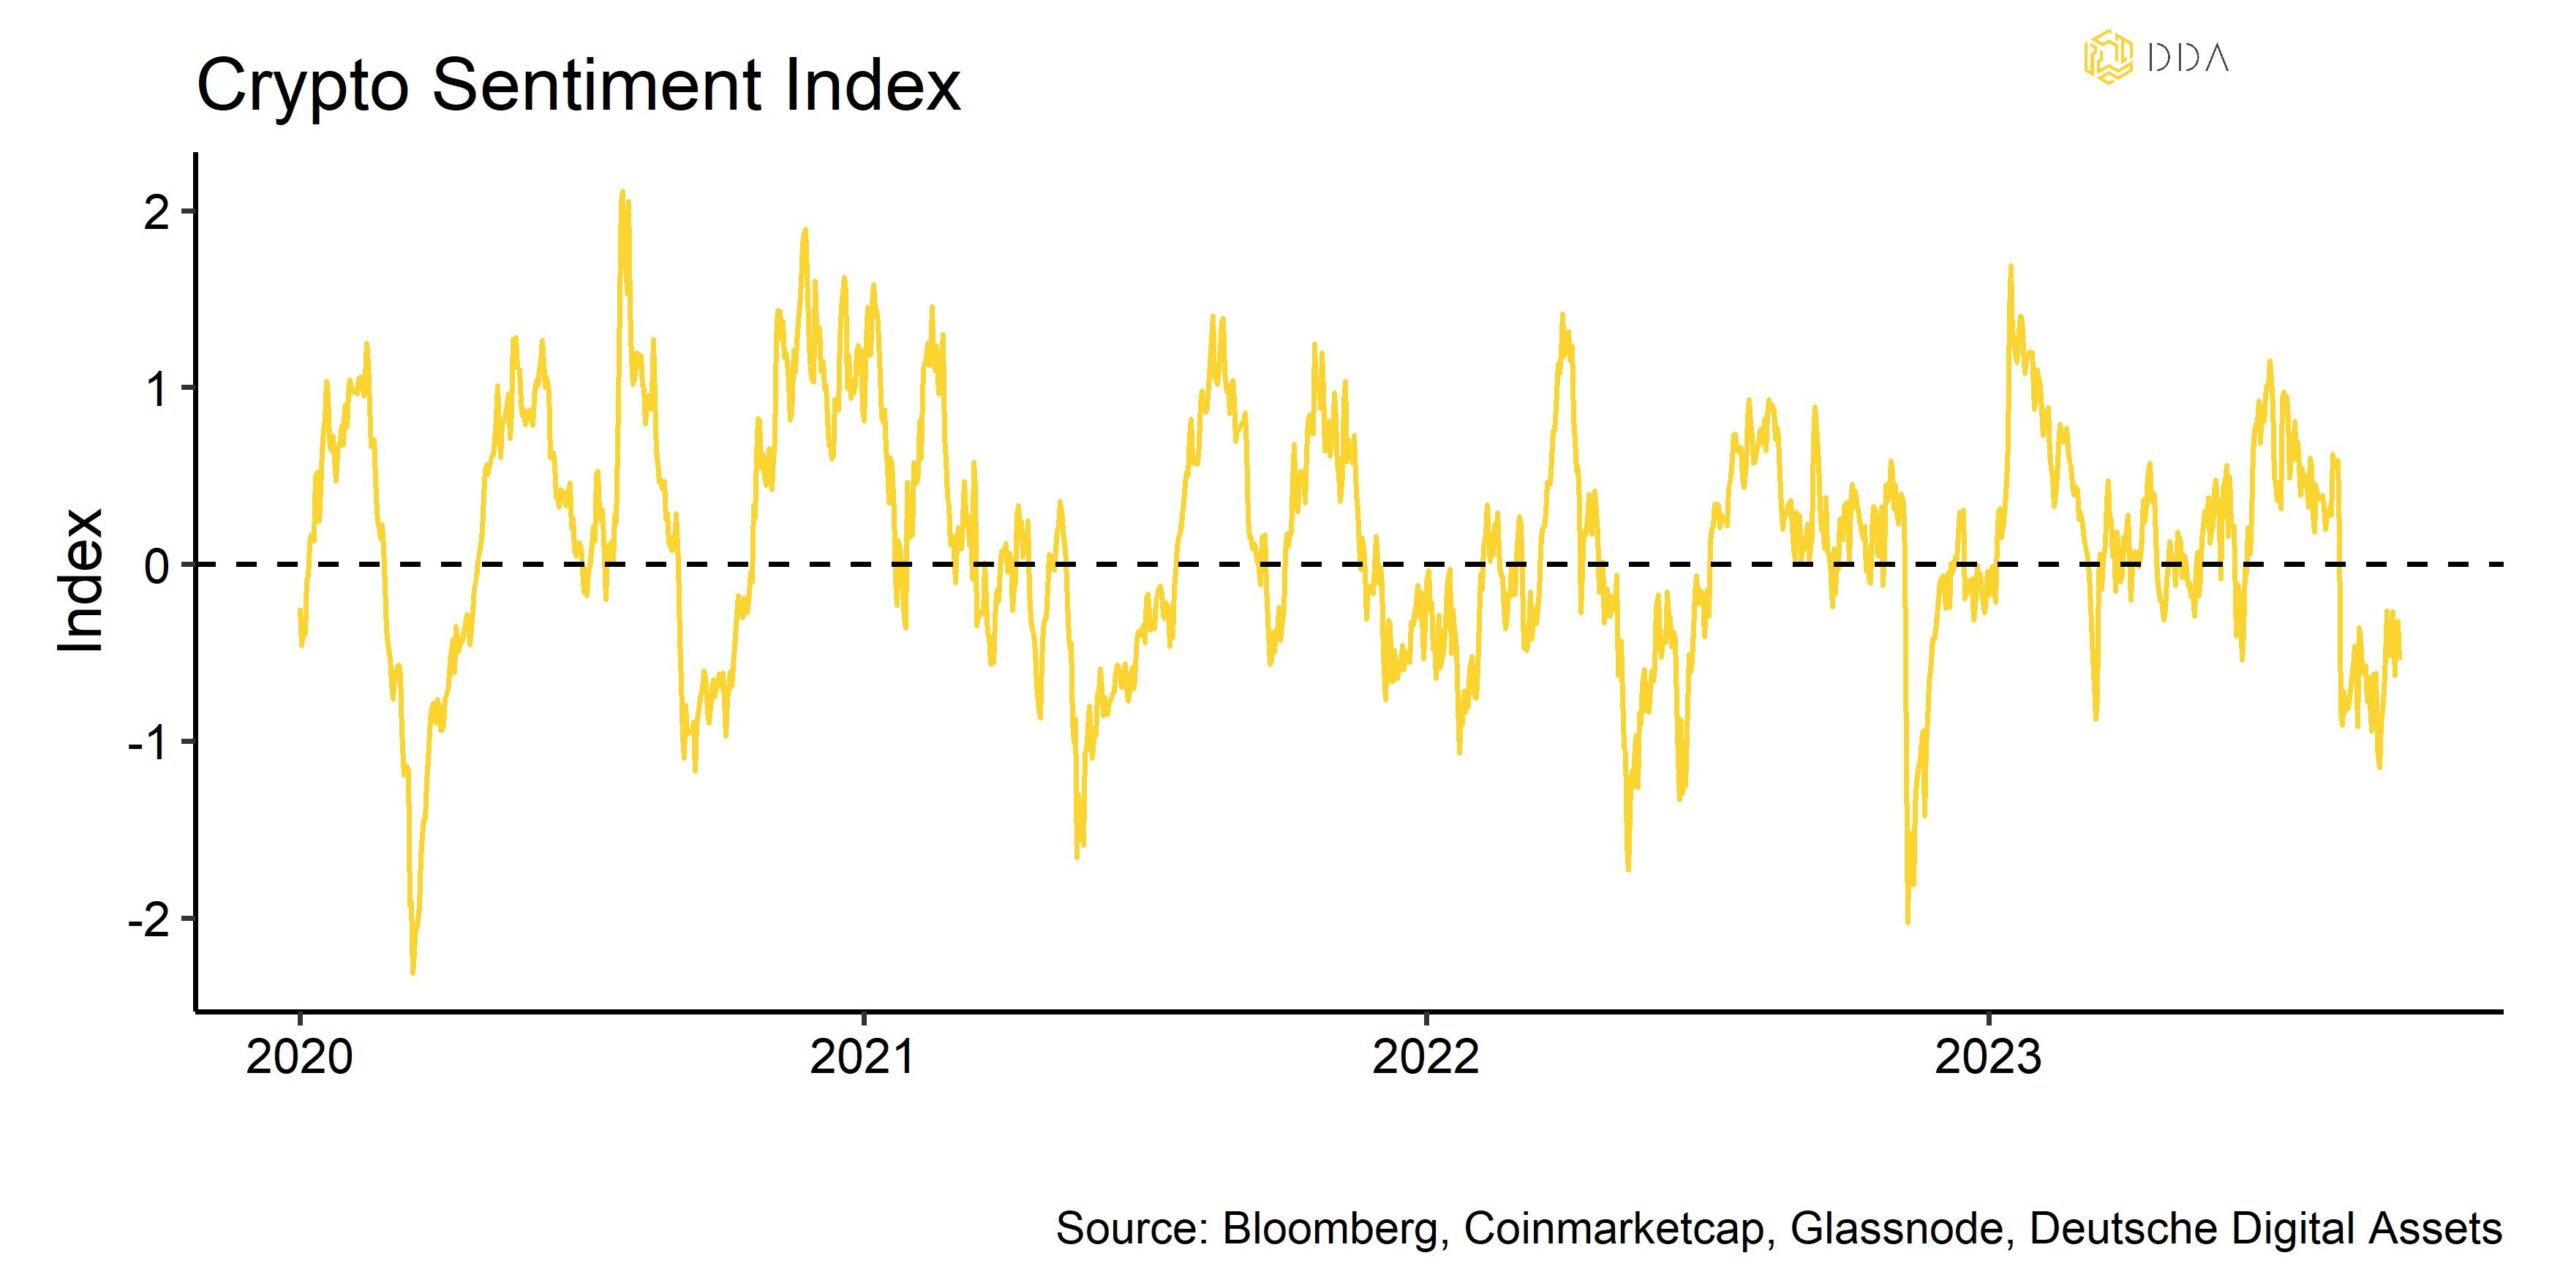
Combined with the fact that overall crypto sentiment is already quite bearish we think that any downside price movements, e.g. on account of further monetary policy tightening, are likely to be rather limited in the short term.
Admittedly, declining macro liquidity has taken its toll on on-chain metrics. Bears have pointed towards the fact that aggregate on-chain liquidity proxied by aggregate stablecoin market caps had been on the decline since mid-2022. More recently, that decline has largely stabilized, and aggregate stablecoin market caps appear to be moving sideways. This is also an encouraging sign.
At the same time, exchange balances are continuing their downward trajectory both for Bitcoin and Ethereum. Bitcoin exchange balances have reached a 5-year low and Ethereum exchange balances have reached a fresh 7-year low.
These developments underscore the fundamental healthiness of both networks and that overall supply scarcity continues to increase. For references, the supply last active over 2 years ago has reached a new all-time high of 56.6% for Bitcoin.
Besides, Bitcoin is entering positive seasonality in October as the last quarter of the year has historically exhibited above-average returns. It seems as if the time to accumulate could not be better. Recent on-chain developments seem to agree with this assessment. Bottom Line: September was a very strong month for Bitcoin on-chain developments as many network metrics such as transaction count or hash rate reached new all-time highs. The potential price effect of the US Spot Bitcoin ETFs looks very promising. At the same time, contrarian accumulation activity combined with bearish sentiment limit any further downside.
Über DDA Deutsche Digital Assets
Deutsche Digital Assets (DDA) ist ein deutscher Digital Asset Manager, der als vertrauenswürdige Anlaufstelle für Investoren dient, die ein Exposure zu Krypto Assets suchen. Über verschiedene Tochtergesellschaften bietet DDA eine Reihe von kryptobezogenen Anlageprodukten an, die von passiven bis hin zu aktiv verwalteten Investmentlösungen reichen. Darüber hinaus bietet das Unternehmen professionelle Anlageberatung für Family Offices, High Net Worth Individuals (HNWI) und institutionelle Anleger an.
Wir bieten hervorragende Leistungen durch vertraute, vertrauenswürdige Anlagevehikel, die den Anlegern die Qualitätsgarantien bieten, die sie von einem erstklassigen Vermögensverwalter verdienen, während wir uns für unsere Mission einsetzen, die Akzeptanz von Kryptoanlagen zu fördern. DDA beseitigt die technischen Risiken von Krypto-Investitionen, indem wir Anlegern vertrauenswürdige und vertraute Mittel zur Investition in Krypto zu branchenführend niedrigen Kosten anbieten.
Haftungsausschluss
Die in diesem Artikel enthaltenen Materialien und Informationen dienen ausschließlich zu Informationszwecken. Die Deutsche Digital Assets, ihre verbundenen Unternehmen und Tochtergesellschaften fordern nicht zu Handlungen auf der Grundlage dieses Materials auf. Dieser Artikel ist weder eine Anlageberatung noch eine Empfehlung oder Aufforderung zum Kauf von Wertpapieren. Die Wertentwicklung ist unvorhersehbar. Die Wertentwicklung in der Vergangenheit ist daher kein Hinweis auf die zukünftige Wertentwicklung. Sie erklären sich damit einverstanden, Ihre eigenen Nachforschungen anzustellen und Ihre Sorgfaltspflicht zu erfüllen, bevor Sie eine Anlageentscheidung in Bezug auf die hier besprochenen Wertpapiere oder Anlagemöglichkeiten treffen. Unsere Artikel und Berichte enthalten zukunftsgerichtete Aussagen, Schätzungen, Projektionen und Meinungen. Diese können sich als wesentlich ungenau erweisen und unterliegen erheblichen Risiken und Unwägbarkeiten, die außerhalb der Kontrolle der Deutsche Digital Assets GmbH liegen. Wir gehen davon aus, dass alle hierin enthaltenen Informationen korrekt und zuverlässig sind und aus öffentlichen Quellen stammen. Diese Informationen werden jedoch "wie besehen" und ohne jegliche Garantie präsentiert.


