Für Anleger, die in die globalen Kryptomärkte investieren wollen, gibt es verschiedene Ansätze für die Zusammensetzung von Krypto-Portfolios, die sich während des Bullenmarktes von 2021 und des Bärenmarktes von H1/2022 jeweils unterschiedlich entwickelt haben.
Lesen Sie weiter, um mehr über die beliebtesten algorithmisch verwalteten Krypto-Portfoliozusammensetzungen zu erfahren und wie sie sich in verschiedenen Marktszenarien entwickelt haben.
Unser Anlageuniversum für diese Studie
Um die Zusammensetzung eines Krypto-Portfolios zu untersuchen, haben wir ein Portfolio mit zehn Münzen ausgewählt.
Die zehn Kryptowährungen sind BTC, ETH, BNB, LTC, XRP, SOL, ADA, AVAX, DOGE und LUNA. Wir haben dieses Universum von Kryptowährungen ausgewählt, um leistungsstarke Coins, Nachzügler und Coins, die sehr gut, aber nur für einen kurzen Zeitraum in der Mischung waren, zu haben, während wir die Anzahl der Coins relativ klein gehalten haben, um die Auswirkungen des LUNA-Absturzes am Ende zu beobachten.
Das Ziel von Algorithmen zur Portfoliobildung
Wenn Sie ein systematisches Portfolio aufbauen wollen, haben Sie mehrere Möglichkeiten.
Am einfachsten ist es, einen Vermögenswert in Abhängigkeit von seiner Marktkapitalisierung zu bewerten (Marktkapitalgewichtetes Portfolio). Ohne Token-Erstellung oder Burns, Airdrops oder Forks muss ein solches Portfolio nicht neu gewichtet werden.
Sie können auch versuchen, das Endrisiko zu minimieren. Diese Art von Portfolio nennt man ein Minimum-Varianz-Portfolio.
Alternativ können Sie versuchen, mit der Diversifizierung zu spielen, und die einfachste Möglichkeit ist, jedem Token das gleiche Budget zuzuweisen (Gleichgewichtetes 1/n-Portfolio).
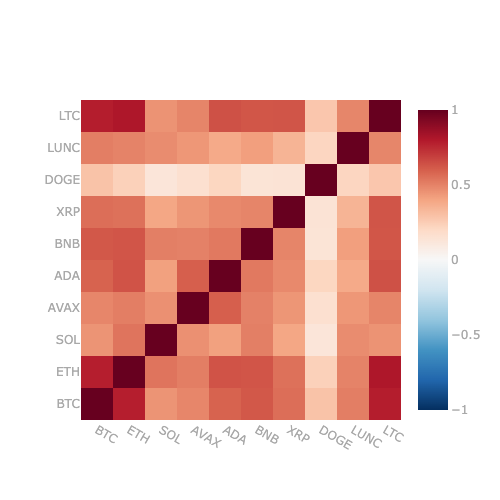
Schließlich können Sie versuchen, die Risiken Ihres Portfolios zu steuern und gleichzeitig eine gewisse Diversifizierung zu erreichen, und das ist das Ziel des Risikoparitätsalgorithmen. Diese Algorithmen verwenden die Korrelationsmatrix, da sie die Beziehungen zwischen den Münzen beschreibt.
Die Kryptowelt ist noch sehr jung, und im Gegensatz zu traditionellen Märkten beschreibt die Korrelationsmatrix ein Universum, in dem die Kreuzkorrelationen sehr hoch sind.
Korrelationen zwischen dem 01/01/2021 und dem 01/05/2022
Für unsere Studie zur Portfoliozusammensetzung haben wir die tägliche Korrelationsmatrix zwischen dem 01/01/2021 und dem 01/05/2022 (kurz vor dem Zusammenbruch von LUNA), und wir können feststellen, dass in diesem Zeitraum die Korrelationen zwischen den verschiedenen Token, außer für Dogecoin (DOGE), zwischen 40% und 80% liegen. Dies bedeutet, dass es kompliziert ist, eine gewisse Diversifizierung zu erreichen, und dass es sich um ein anspruchsvolles Umfeld für Optimierer handelt, in dem wir mit einer gewissen Instabilität rechnen müssen.
Arten von Krypto-Portfolio-Zusammensetzungen
Werfen wir einen Blick auf die gängigsten Ansätze zur Portfoliozusammensetzung auf den Märkten für digitale Vermögenswerte.
Marktkapitalisierungsgewichteter Index
In einem nach Marktkapitalisierung gewichteten Krypto-Portfolio wird das Gewicht eines Token-Bestands im Portfolio durch die Marktkapitalisierung dieses Tokens im Vergleich zur Summe der Marktkapitalisierungen aller Token im Index bestimmt. Die meisten führenden Aktienindizes, wie z. B. der S&P 500 oder der DJ EuroStoxx 50, verwenden diesen Zusammensetzungsansatz.
Gleichgewichtetes Portfolio (1/n)
Ein gleichgewichtetes Krypto-Portfolio hält den gleichen Prozentsatz an jedem Token und zielt auf eine breite Diversifizierung ab. In unserem Fall werden wir täglich um Mitternacht UTC ein Rebalancing durchführen.
Minimum-Varianz-Portfolio (MVP)
Ein Minimum-Varianz-Portfolio zielt, wie der Name schon sagt, auf eine algorithmische Minimierung der Varianz des Portfolios ab. Die Varianz ist das Quadrat der Volatilität.
Gleichmäßig risikogewichtetes (ERC) Portfolio
Ein ERC-Portfolio zielt darauf ab, jedem Token die gleiche Menge an Risiko zuzuweisen, d.h. der Risikobeitrag jedes Vermögenswerts zum Portfolio sollte gleich sein. Dieses Portfolio liegt zwischen dem gleichgewichteten Portfolio (1/n) und dem Minimum-Varianz-Portfolio und ist einer der am häufigsten verwendeten Algorithmen zur Portfoliozusammensetzung.
Für dieses Portfolio wurde ein tägliches Rebalancing um Mitternacht UTC mit einem Berechnungszeitraum von 90 Tagen x 24 Stunden unter Verwendung stündlicher Daten durchgeführt.
Inverses Varianzportfolio (IVP)
Bei einem Portfolio mit inverser Varianz wird jeder Vermögenswert proportional zum Kehrwert der Varianz des Vermögenswerts zugewiesen. Die Varianz ist das Quadrat der Volatilität. Wir können feststellen, dass dieser Algorithmus der Risikoparität die Kovarianzmatrix nicht berücksichtigt.
Für dieses Portfolio wurde ein tägliches Rebalancing um Mitternacht UTC mit einem Berechnungszeitraum von 90 Tagen x 24 Stunden unter Verwendung stündlicher Daten durchgeführt.
Hierarchische Risikoparität (HRP) Portfolio
Die Portfoliokalkulation eines HRP ist komplexer. Er verwendet den Algorithmus der Hierarchischen Risikoparität entwickelt von Marco Lopez de Prado aus dem Jahr 2016. Dieser Algorithmus nutzt die Graphentheorie und Techniken des maschinellen Lernens, um ein diversifiziertes Portfolio aufzubauen, ohne die Kovarianzmatrix zu invertieren, was eine Quelle der Instabilität ist (insbesondere in unserem Fall, wie wir zuvor gesehen haben).
Der erste Schritt besteht in einer Clusterbildung auf der Grundlage der Kovarianzmatrix und der zweite in einer 3/7-Gewichtsverteilung in diesen Clustern. Die Ergebnisse des HRP-Algorithmus sind in der Regel stabiler und robuster als die der traditionellen Risikoparitätsalgorithmen.
Wie haben sich verschiedene Portfoliozusammensetzungen in den letzten Krypto-Bullen- und -Bärenmärkten entwickelt?
Werfen wir nun einen Blick darauf, wie sich jedes dieser Portfolios während der jüngsten Hausse und Baisse im Zeitraum von 2020 bis Mitte 2022 entwickelt hat.
Wertentwicklung des Portfolios 2020 bis 20/05/22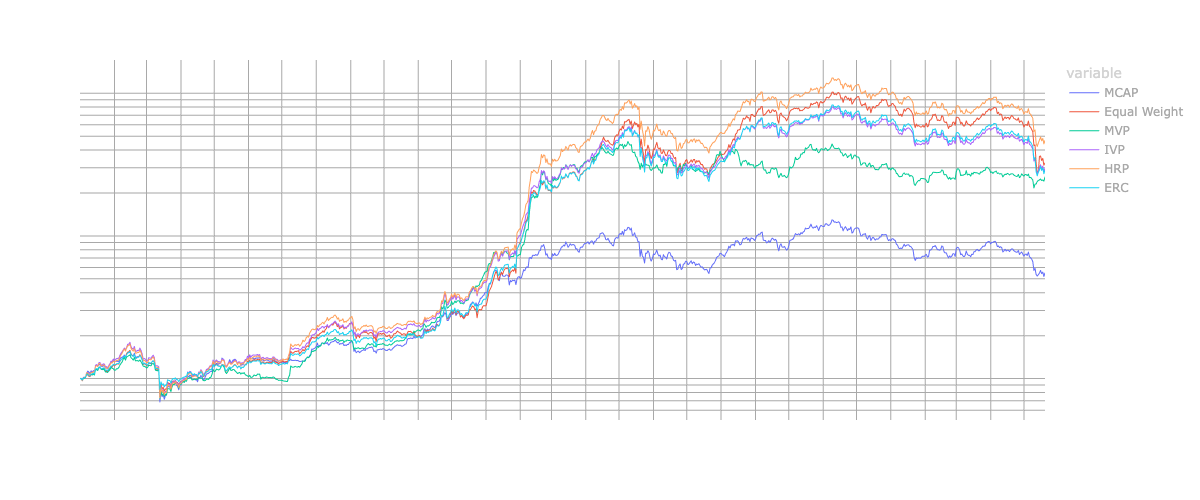
Betrachtet man die Performance unserer Modellportfolios, so kann man feststellen, dass im Jahr 2020 und in einer weltweiten Hausse, die von Bitcoin (BTC)Die verschiedenen Portfolios zeigten eine ähnliche Performance, während HRP, MVP und IVP eine leichte Outperformance erzielten.
Im Jahr 2021, in dem der Markt eine rasante Altcoin-Hausse erlebte, sieht die Geschichte anders aus. Alle Portfolios, insbesondere aber das Hierarchical Risk Parity (HRP)-Portfolio, schnitten deutlich besser ab als der Marktkapitalisierungsindex.
In unserem Anlageuniversum haben wir einige große Gewinner des Jahres 2021 (DOGE, SOL, AVAX, LUNA) für diese Studie ausgewählt. Eine Allokation, die einen wesentlichen Teil des Portfolios diesen Vermögenswerten zuweist, würde also ein Portfolio, das hauptsächlich in Bitcoin investiert ist, deutlich übertreffen.
Dennoch konnten wir in diesem besonders günstigen Umfeld mit einer Outperformance des risikoreichsten Portfolios - dem gleichgewichteten 1/n-Portfolio - rechnen. Das HRP konnte jedoch eine deutlich bessere Performance erzielen.
Wir stellen außerdem fest, dass das MVP in der zweiten Jahreshälfte hinter den anderen Risikoparitätsmodellen zurückbleibt, da es den Sommeraufschwung nicht erwischt. Allerdings gelingt es ihm, die Hausse der Altcoins im 1. Quartal 2021 zu erfassen, und am Ende übertrifft es das nach Marktkapitalisierung gewichtete Portfolio deutlich, auch wenn es defensiver sein sollte.
Vergrößern Sie das Jahr 2022
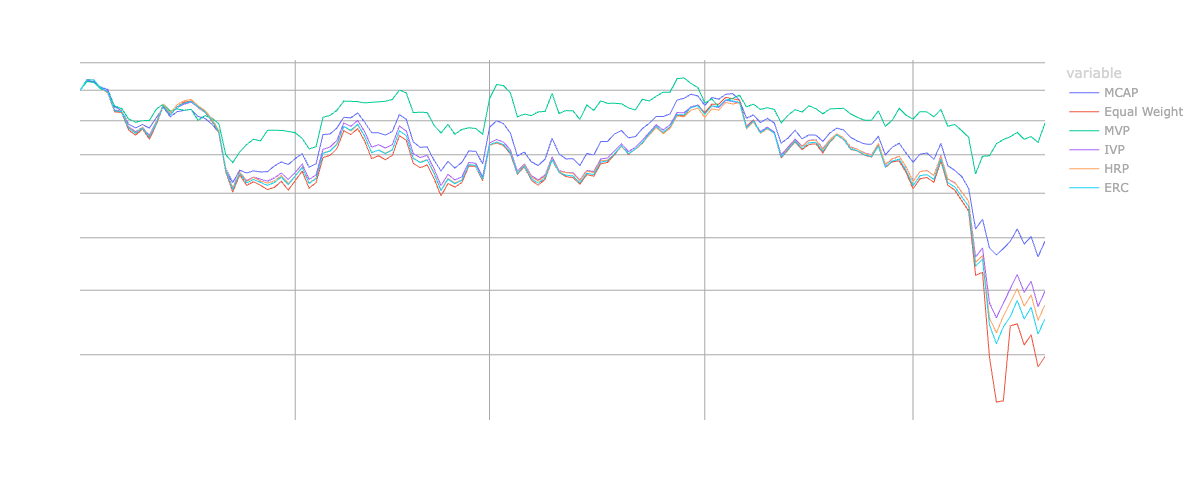
Wenn wir das Jahr 2022 näher betrachten, können wir sehen, wie sich die verschiedenen Portfoliozusammensetzungen während der Baisse und nach dem Crash von Luna verhalten haben.
Wir können feststellen, dass das MVP-Portfolio das Risiko effektiv minimierte und die anderen Portfolios deutlich übertraf. Dann übertrifft das marktkapitalgewichtete Portfolio mit seiner größeren Allokation in die nach Marktkapitalisierung größten Krypto-Assets, die in dieser Phase als defensive Strategie angesehen werden könnte, die anderen Portfolios. Wir können feststellen, dass dieses Portfolio während des Crashs nicht in LUNA umschichtet, sondern nur den dedizierten LUNA-Anteil auf Null gehen lässt.
Andere Portfolios haben ein größeres Engagement in LUNA, da sie ausgewogener sind, aber auch einen Rebalancing-Mechanismus, der das Engagement in LUNA erhöhen oder verringern kann.
Einerseits wird die Volatilität oder die Varianz explodieren, also das damit verbundene Risiko, und wir können sicher sein, dass das MVP-Portfolio sein Engagement in diesem Bereich verringern wird, und IVP wird es drastisch reduzieren. Andererseits ist die prozentuale Aufteilung des Portfolios stark zurückgegangen, und eine Neugewichtung sollte das Engagement erhöhen.
Letztendlich können wir feststellen, dass das IVP mit Ausnahme des MVP die beste Risikoparitäts-Performance aufweist (da es am empfindlichsten auf den Anstieg eines isolierten Risikos reagiert), gefolgt vom HRP, dann vom ERC und schließlich vom gleichgewichteten Portfolio, das während des Crashs eine massive Underperformance aufweist.
Bonus: KPIs der Portfolios
Wenn Sie einen tieferen Einblick in unsere Modellportfolios erhalten möchten, können Sie unten alle KPIs für den Zeitraum Januar 2021 bis Mai 2022 und Januar 2022 bis Mai 2022 einsehen.
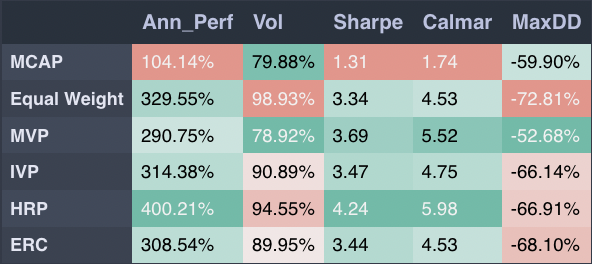
2021 - 05/2022 Zeitraum
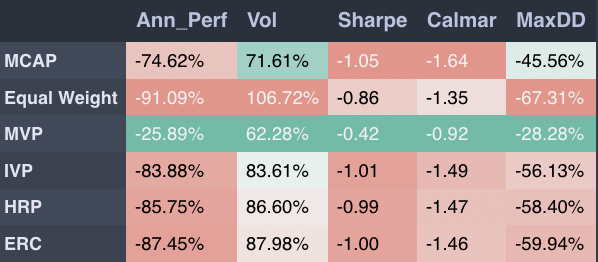
2022
Schlussfolgerung
Langfristig hinkt das nach der Marktkapitalisierung gewichtete Portfolio aufgrund seiner starken Allokation in die größten Coins während heftiger Haussen hinterher und hält sich im Vergleich zu den anderen Portfolios in Bärenmärkten und bei extremen Ereignissen gut (solange diese Ereignisse nicht Bitcoin oder Ethereum).
Auf der anderen Seite ist das HRP-Portfolio einer der großen Gewinner. Es schneidet während der Hausse besser ab und hält sich im Vergleich zu anderen Risikoparitätsportfolios bei extremen Ereignissen relativ gut. Es ist eigentlich nicht überraschend, dass die Effizienz von Risikoparitätsalgorithmen von der Stabilität der Kovarianzmatrix abhängt, da die meisten von ihnen eine Inversion dieser Matrix erfordern.
Bei einem traditionellen Portfolio ist dies grosso modo der Fall, da man im Allgemeinen unkorrelierte Vermögenswerte zusammenstellt. Aber in der Kryptowelt sind die Korrelationen zwischen Token sehr hoch. Dies verschafft dieser Methode einen Vorteil, da sie keine Inversion der Kovarianzmatrix benötigt und im Allgemeinen stabilere Ergebnisse liefert.
Zu guter Letzt können wir die Performance eines MVP-Portfolios beobachten, das das Beste aus beiden Welten vereint: Es fängt einen großen Teil der Hausse bei Altcoins ab und übertrifft das marktkapitalgewichtete Portfolio massiv. Darüber hinaus widersteht es auch dem Bärenmarkt ab 2022 und übertrifft schließlich die anderen Portfolios beim Crash der LUNA deutlich.
Zusammenfassend lässt sich sagen, dass ein HRP-Portfolio am besten geeignet war, um seine Gewinne über den langfristigen Zeitraum zu maximieren. Bei risikoarmen Profilen oder einer größeren Empfindlichkeit gegenüber Drawdowns schnitt das MVP-Portfolio sowohl in der wilden Hausse von 2021 als auch in der Baisse von 2022 weitaus besser ab als das nach Marktkapitalisierung gewichtete Portfolio.
Dies legt nahe, dass aktiv gemanagte, quantitative Anlagestrategien wird wahrscheinlich besser abschneiden als das beliebte marktkapitalisierungsgewichtete Portfolio auf den Märkten für digitale Vermögenswerte.
Investieren Sie in algorithmisch gesteuerte, maßgeschneiderte Krypto-Fonds mit Iconic
Aktive Anlagestrategien ermöglichen es Fondsmanagern, ihren Kunden maßgeschneiderte Portfolios mit klar umrissenen Risiko- und Renditeerwartungsparametern anzubieten.
Die Iconic Alpha AG ist der neu gegründete, aktiv gemanagte Krypto-Investmentarm von Iconic, der sich auf quantitative und algorithmische Handelslösungen spezialisiert hat.
Durch eine Kombination aus lang-kurz und Smart-Beta-Strategien Angetrieben von eigens entwickelten Handelsalgorithmen bietet Iconic Alpha separat verwaltete Konten (Separate Managed Accounts, SMAs) für vermögende Privatpersonen und professionelle Anleger an, die ein Engagement in den globalen Kryptomärkten ohne die hohe Volatilität suchen.
Um mehr über Iconic Quantitative Solutions zu erfahren und wie Sie in einen aktiv verwalteten Kryptofonds investieren können, klicken Sie auf hier.
Über DDA Ikonische Fonds
Iconic Funds ist die Brücke zu Krypto-Investitionen durch vertrauenswürdige Anlageinstrumente. Wir bieten Anlegern sowohl passive als auch Alpha-Strategien für Kryptowährungen sowie Risikokapitalmöglichkeiten.
Wir liefern hervorragende Leistungen durch vertraute, regulierte Vehikel, die den Anlegern die Qualitätsgarantien bieten, die sie von einem erstklassigen Vermögensverwalter erwarten, während wir unsere Mission verfolgen, die Verbreitung von Kryptoanlagen voranzutreiben.
Aktuelle Nachrichten und Artikel
- Wie man in Ethereum (ETH) investiert: Ein Leitfaden für professionelle Anleger
- Das Argument für aktiv verwaltete Anlagestrategien auf den Kryptomärkten
- Iconic startet aktiv verwaltete Krypto-Anlageplattform mit dem kürzlich erworbenen Quantitative Solutions Team
- Wie man in NFTs investiert: Ein Leitfaden für professionelle Anleger
- Bitcoin vs. Gold: Warum Sie wahrscheinlich besser dran sind, wenn Sie "digitales Gold" kaufen
- Warum die Volatilität von Bitcoin Sie nicht erschrecken sollte
- Wie genau ist das Bitcoin Stock-to-Flow-Modell?
Iconic in der Presse
- ETF-Stream: Zahl der White-Label-Emittenten in Europa innerhalb einer Woche verdreifacht
- ETF-Strategie: Iconic Funds lanciert das weltweit erste Krypto-ETP auf ApeCoin
- Das Investment: Kryptowährungen kommen 2022 im Mainstream an
- Private Banking Magazin, Bitcoin - das perfekte Beispiel für ein ESG-Investment?
- Institutionelles Geld, Krypto-Manager steigt bei Family Office ein
- Morningstar, Iconic Funds erweitert seine Produktpalette mit einem physischen Ethereum-ETP
Aktuelle Forschungsberichte

Wie haben sich die Portfolios während der Pandemie entwickelt? ➡ Hier herunterladen
Analyse der wichtigsten Werttreiber der führenden Kryptowährungen ➡ Hier herunterladen
Wie effektiv sind gängige Anlagestrategien mit Bitcoin? ➡ Hier herunterladen
Untersuchung des Mythos der Nullkorrelation zwischen Kryptowährungen und Marktindizes ➡ Hier herunterladen
Weitere Informationen finden Sie unter deutschedastg
Haftungsausschluss
Die in diesem Artikel enthaltenen Materialien und Informationen dienen ausschließlich zu Informationszwecken. Die Iconic Holding GmbH, ihre verbundenen Unternehmen und Tochtergesellschaften fordern nicht zu Handlungen auf der Grundlage dieses Materials auf. Dieser Artikel ist weder eine Anlageberatung noch eine Empfehlung oder Aufforderung zum Kauf von Wertpapieren. Die Wertentwicklung ist unvorhersehbar. Die Wertentwicklung in der Vergangenheit ist daher kein Hinweis auf die zukünftige Wertentwicklung. Sie erklären sich damit einverstanden, Ihre eigenen Nachforschungen anzustellen und Ihre Sorgfaltspflicht zu erfüllen, bevor Sie eine Anlageentscheidung in Bezug auf die hier besprochenen Wertpapiere oder Anlagemöglichkeiten treffen. Unsere Artikel und Berichte enthalten zukunftsgerichtete Aussagen, Schätzungen, Projektionen und Meinungen. Diese können sich als wesentlich ungenau erweisen und unterliegen erheblichen Risiken und Unwägbarkeiten, die außerhalb der Kontrolle der Iconic Holding GmbH liegen. Wir gehen davon aus, dass alle hierin enthaltenen Informationen korrekt und zuverlässig sind und aus öffentlichen Quellen stammen. Diese Informationen werden jedoch "wie besehen" und ohne jegliche Garantie präsentiert.


