Krypto Market Intelligence April 2023
von André DragoschLeiter der Forschung
Wichtigste Erkenntnisse
- Kryptoassets verzeichneten im April eine weitere positive Entwicklung aufgrund des erfolgreichen Ethereum Shapella-Upgrades
- On-Chain-Indikatoren für Bitcoin deuten auf eine solide Netzwerkaktivität aufgrund der anhaltenden Inskriptionssaga, aber auch auf eine nachlassende Akkumulationsaktivität im April hin
- Zunehmende Risiken für US-Staaten angesichts der Schuldenobergrenze und der De-Dollarisierung stehen an der Makrofront im Mittelpunkt
Grafik des Monats

Kryptoasset Leistung
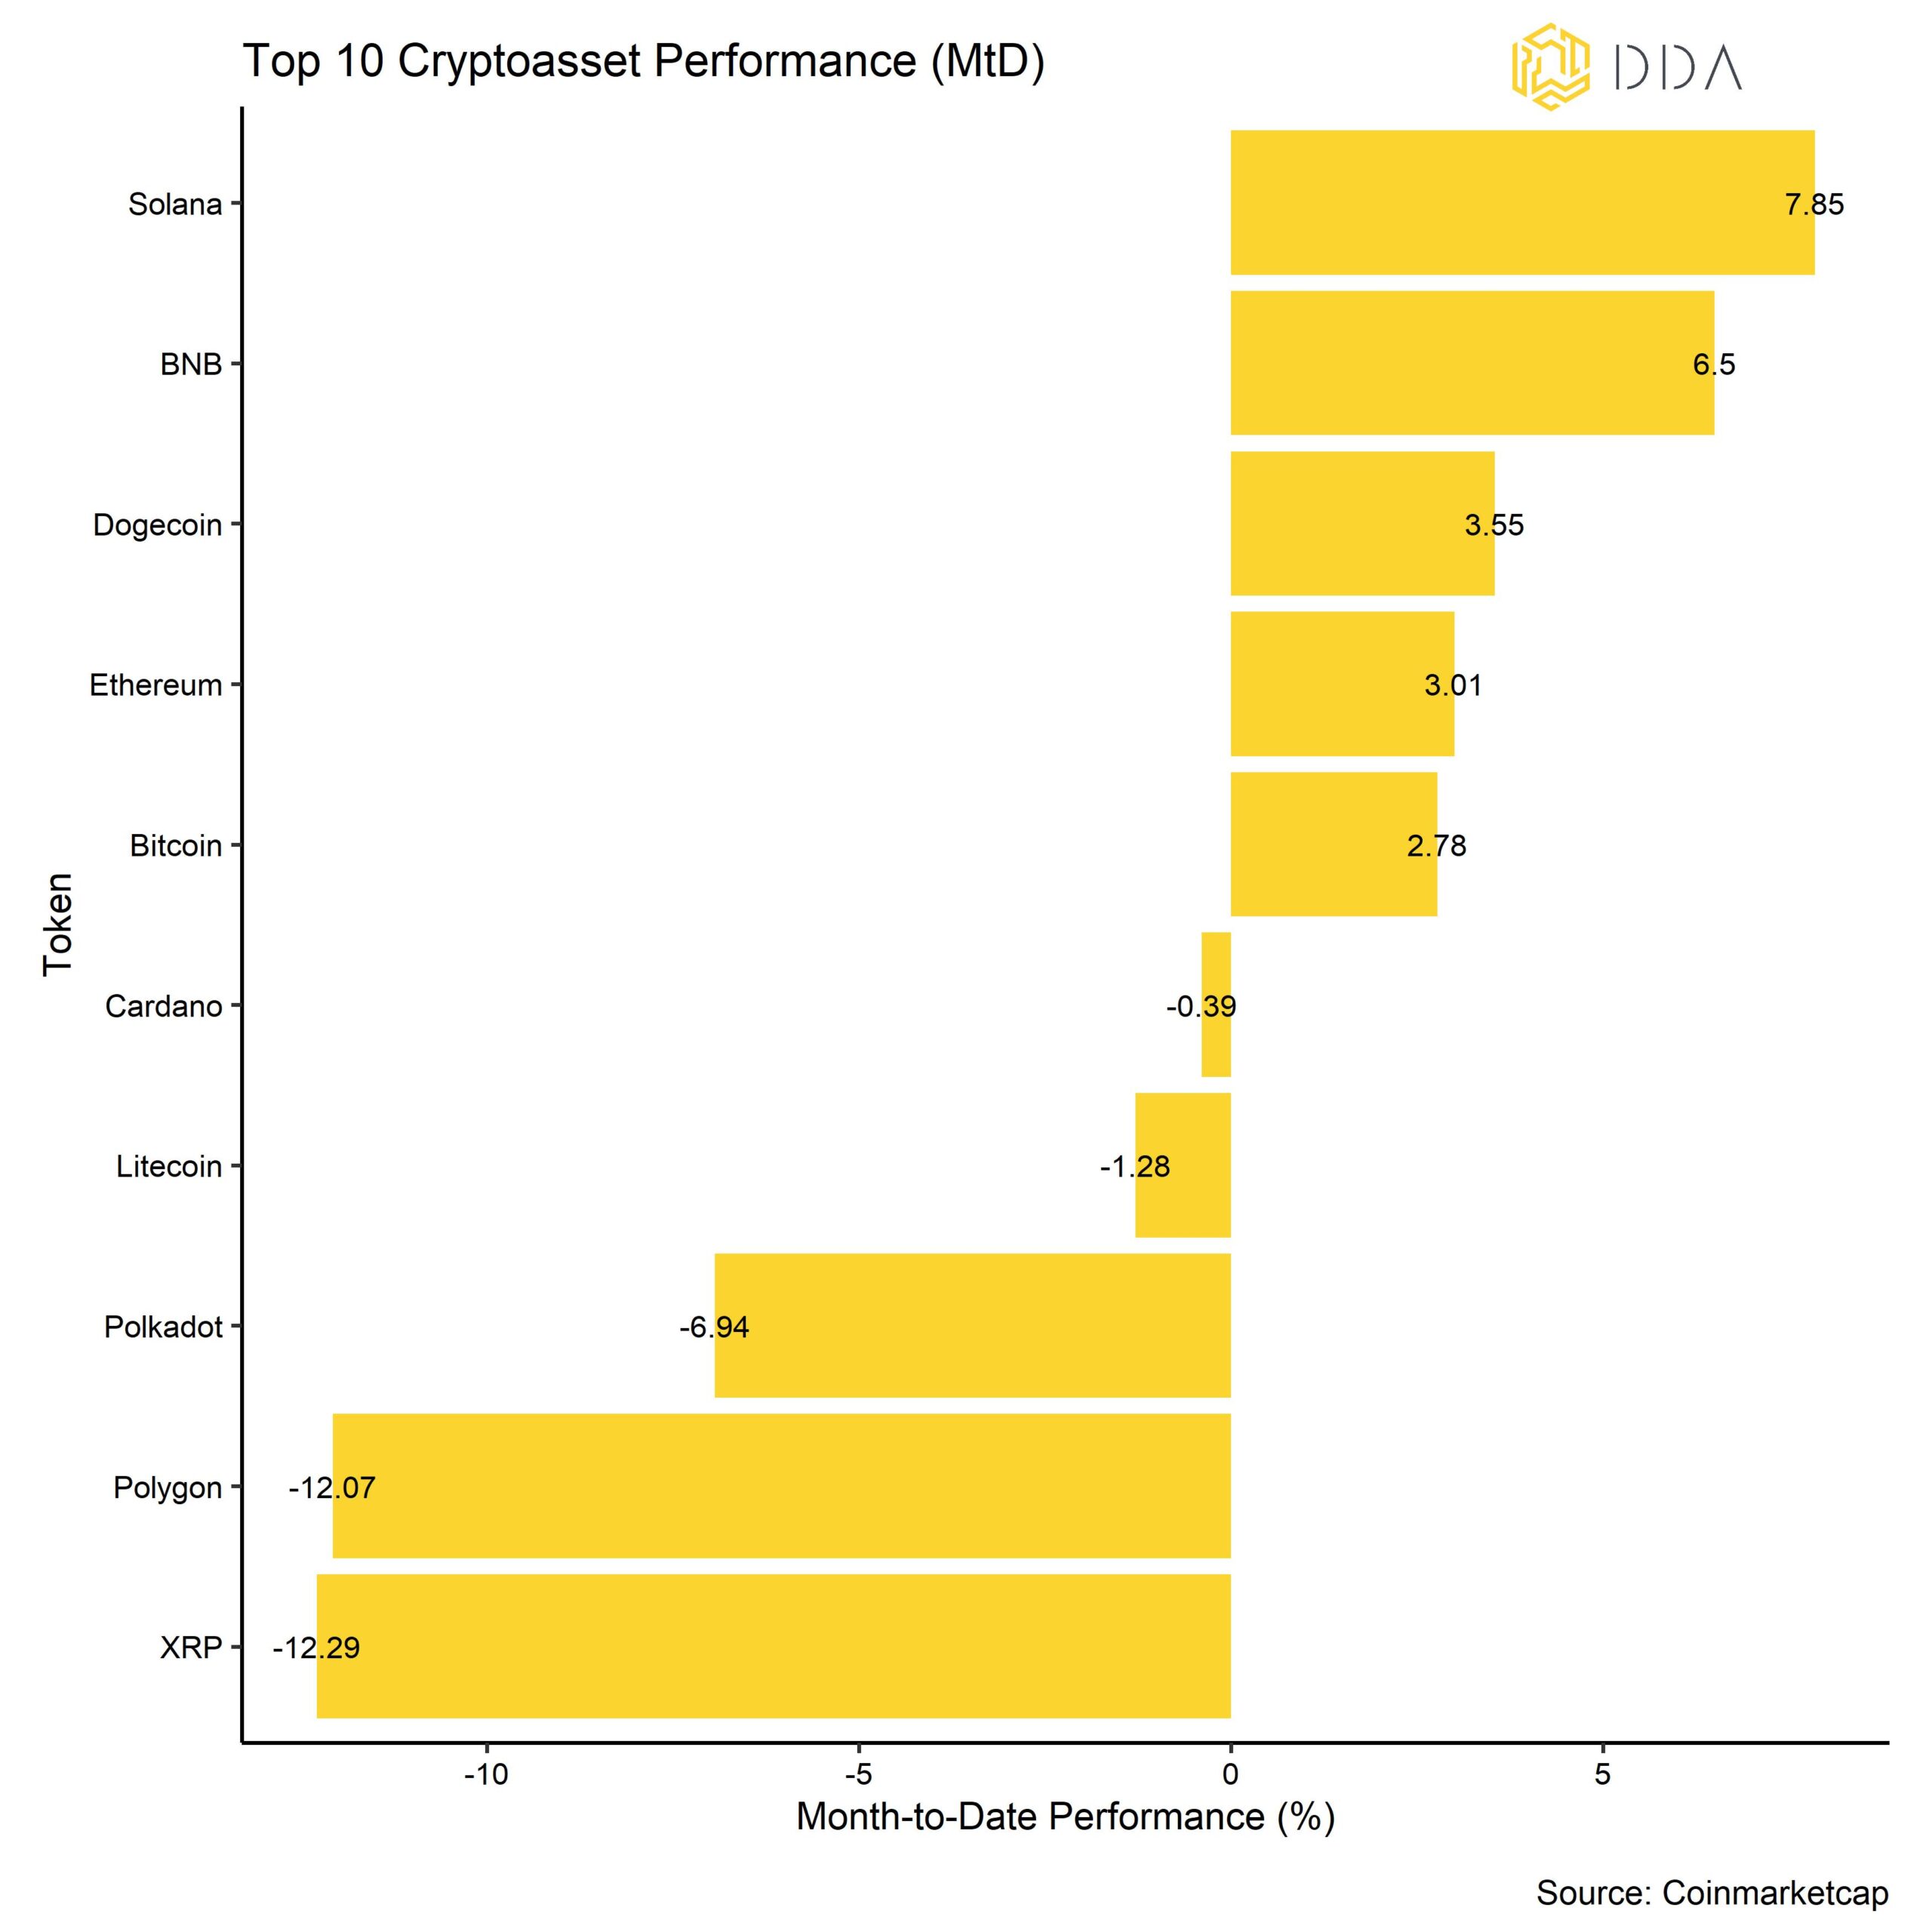
Kryptoassets verzeichneten im April erneut eine positive Performance, was auf das erfolgreiche Ethereum Shapella-Upgrade und die anhaltend hohe Netzwerkaktivität bei Bitcoin aufgrund der Einschreibe-Saga zurückzuführen ist.
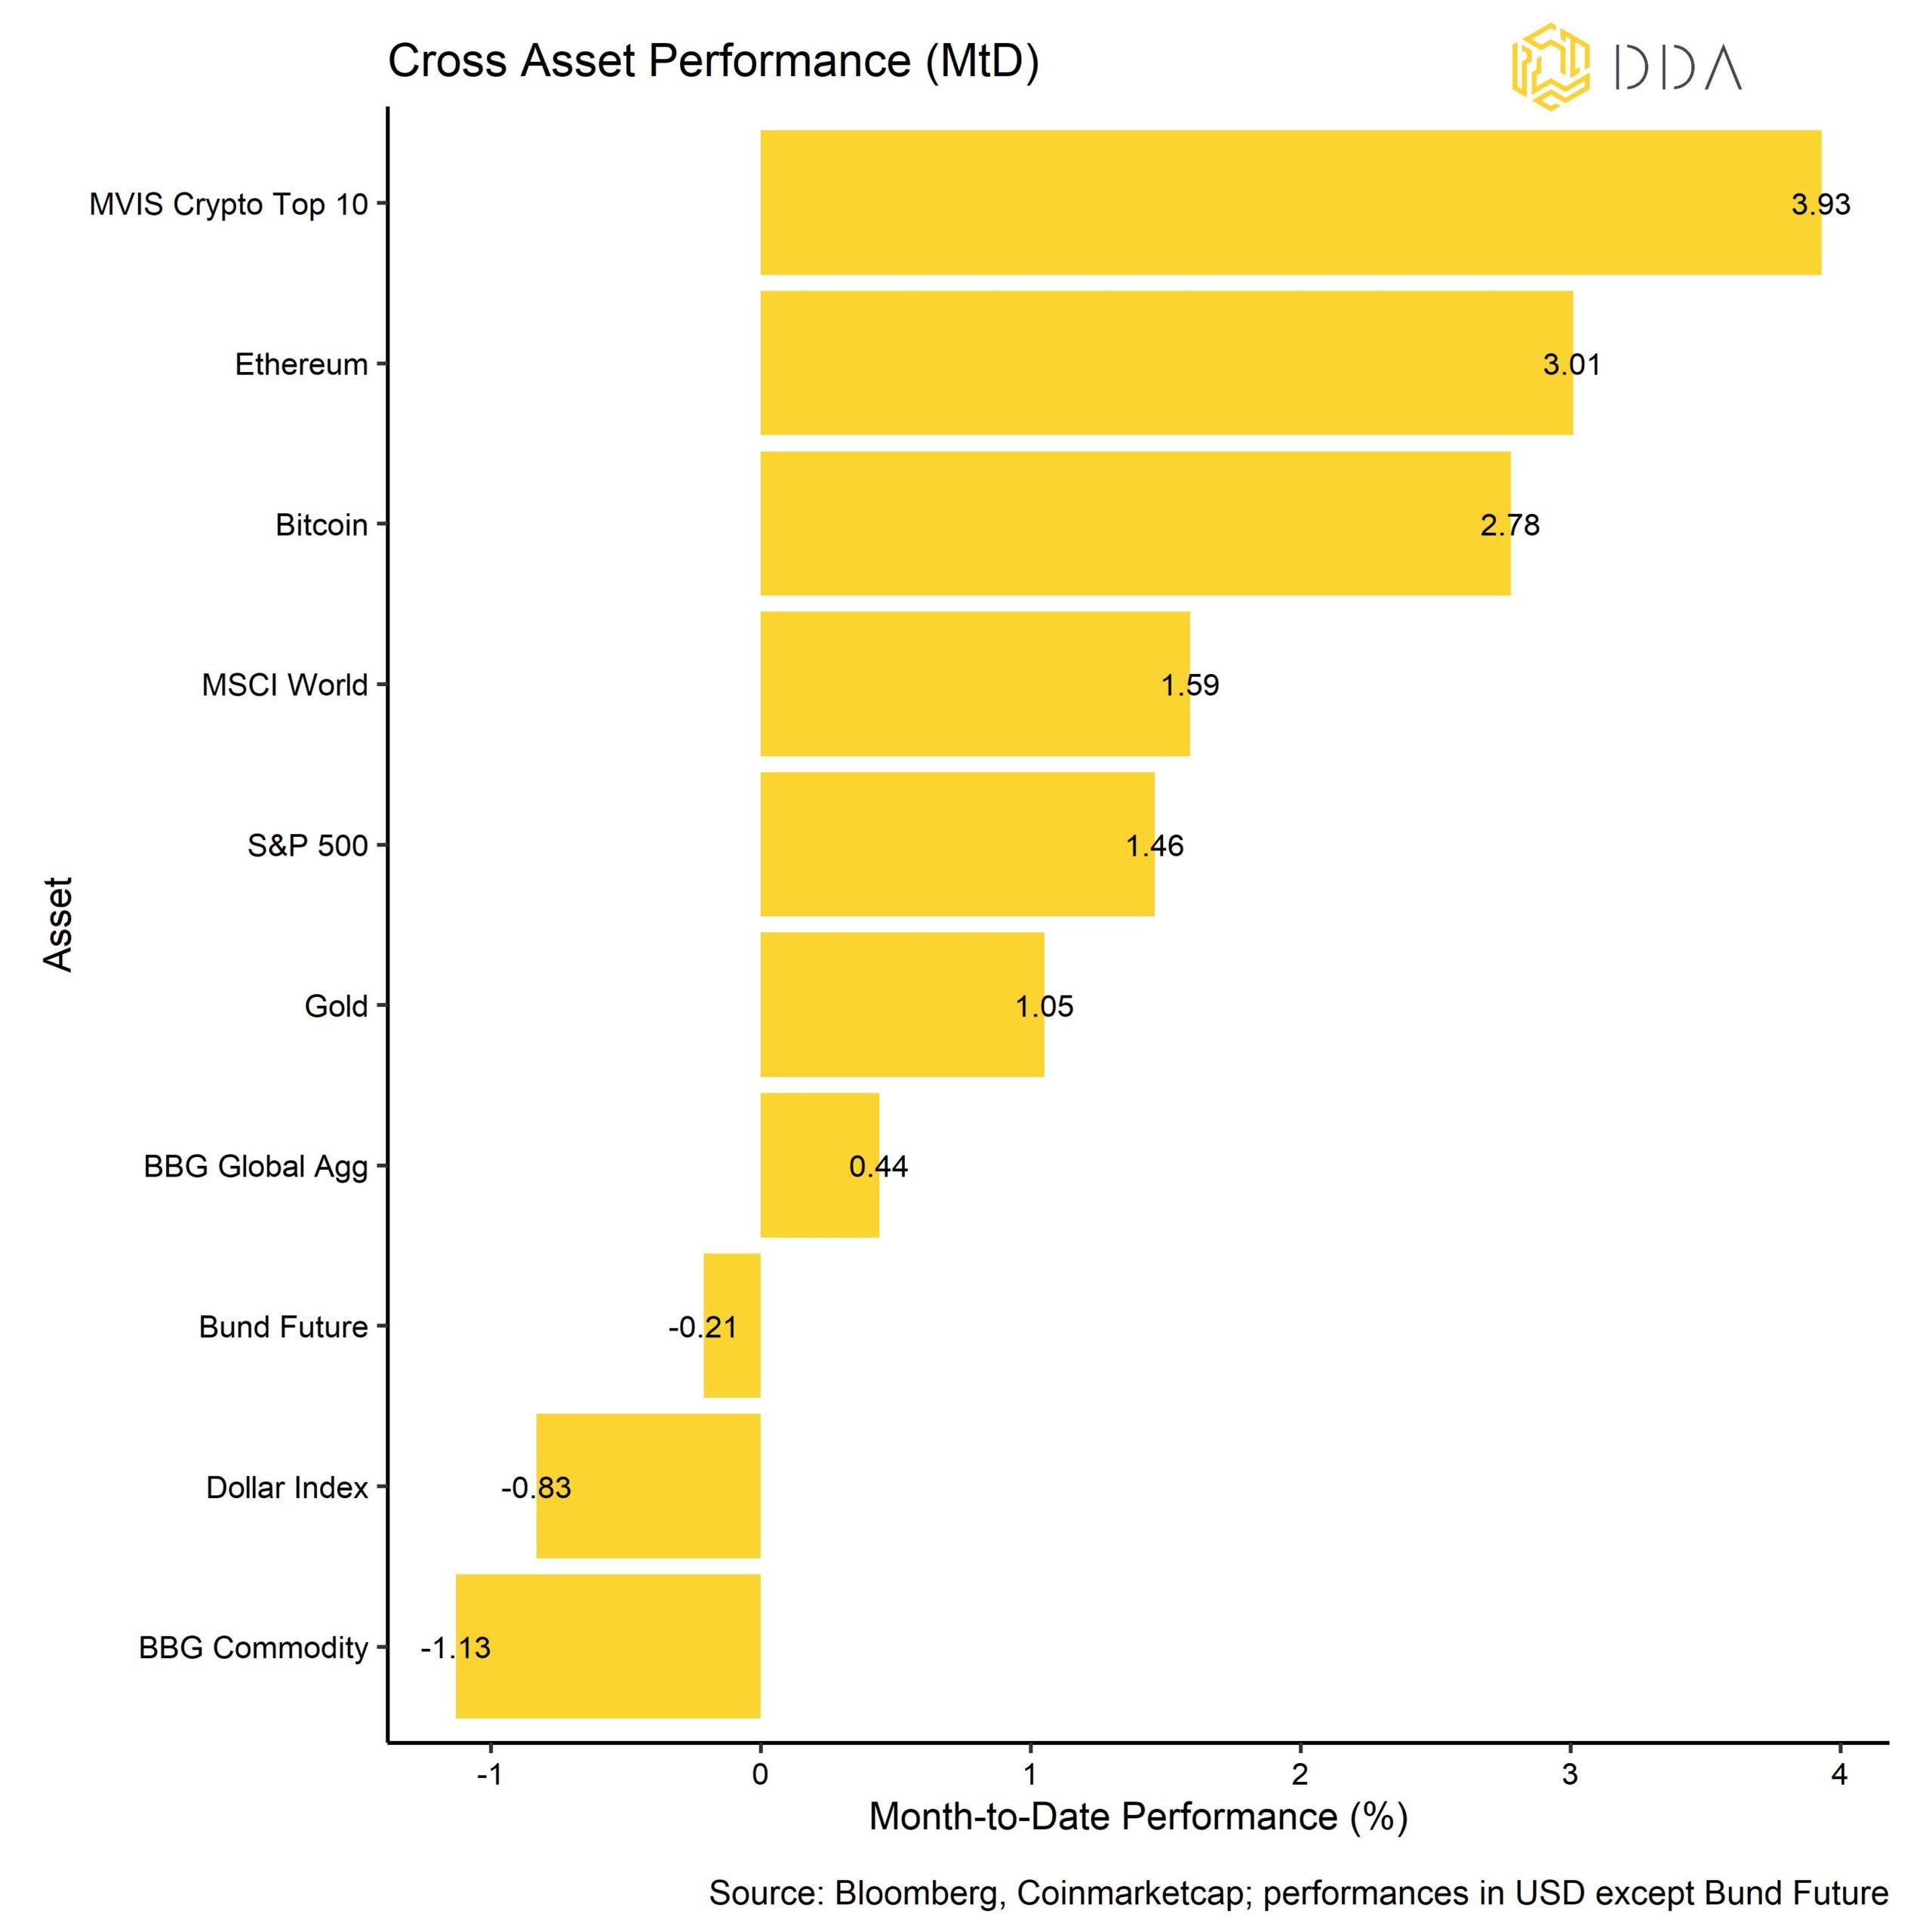
Auch unsere eigenen DDA-Produkte spiegeln diese positive Leistungsentwicklung im April recht gut wider:
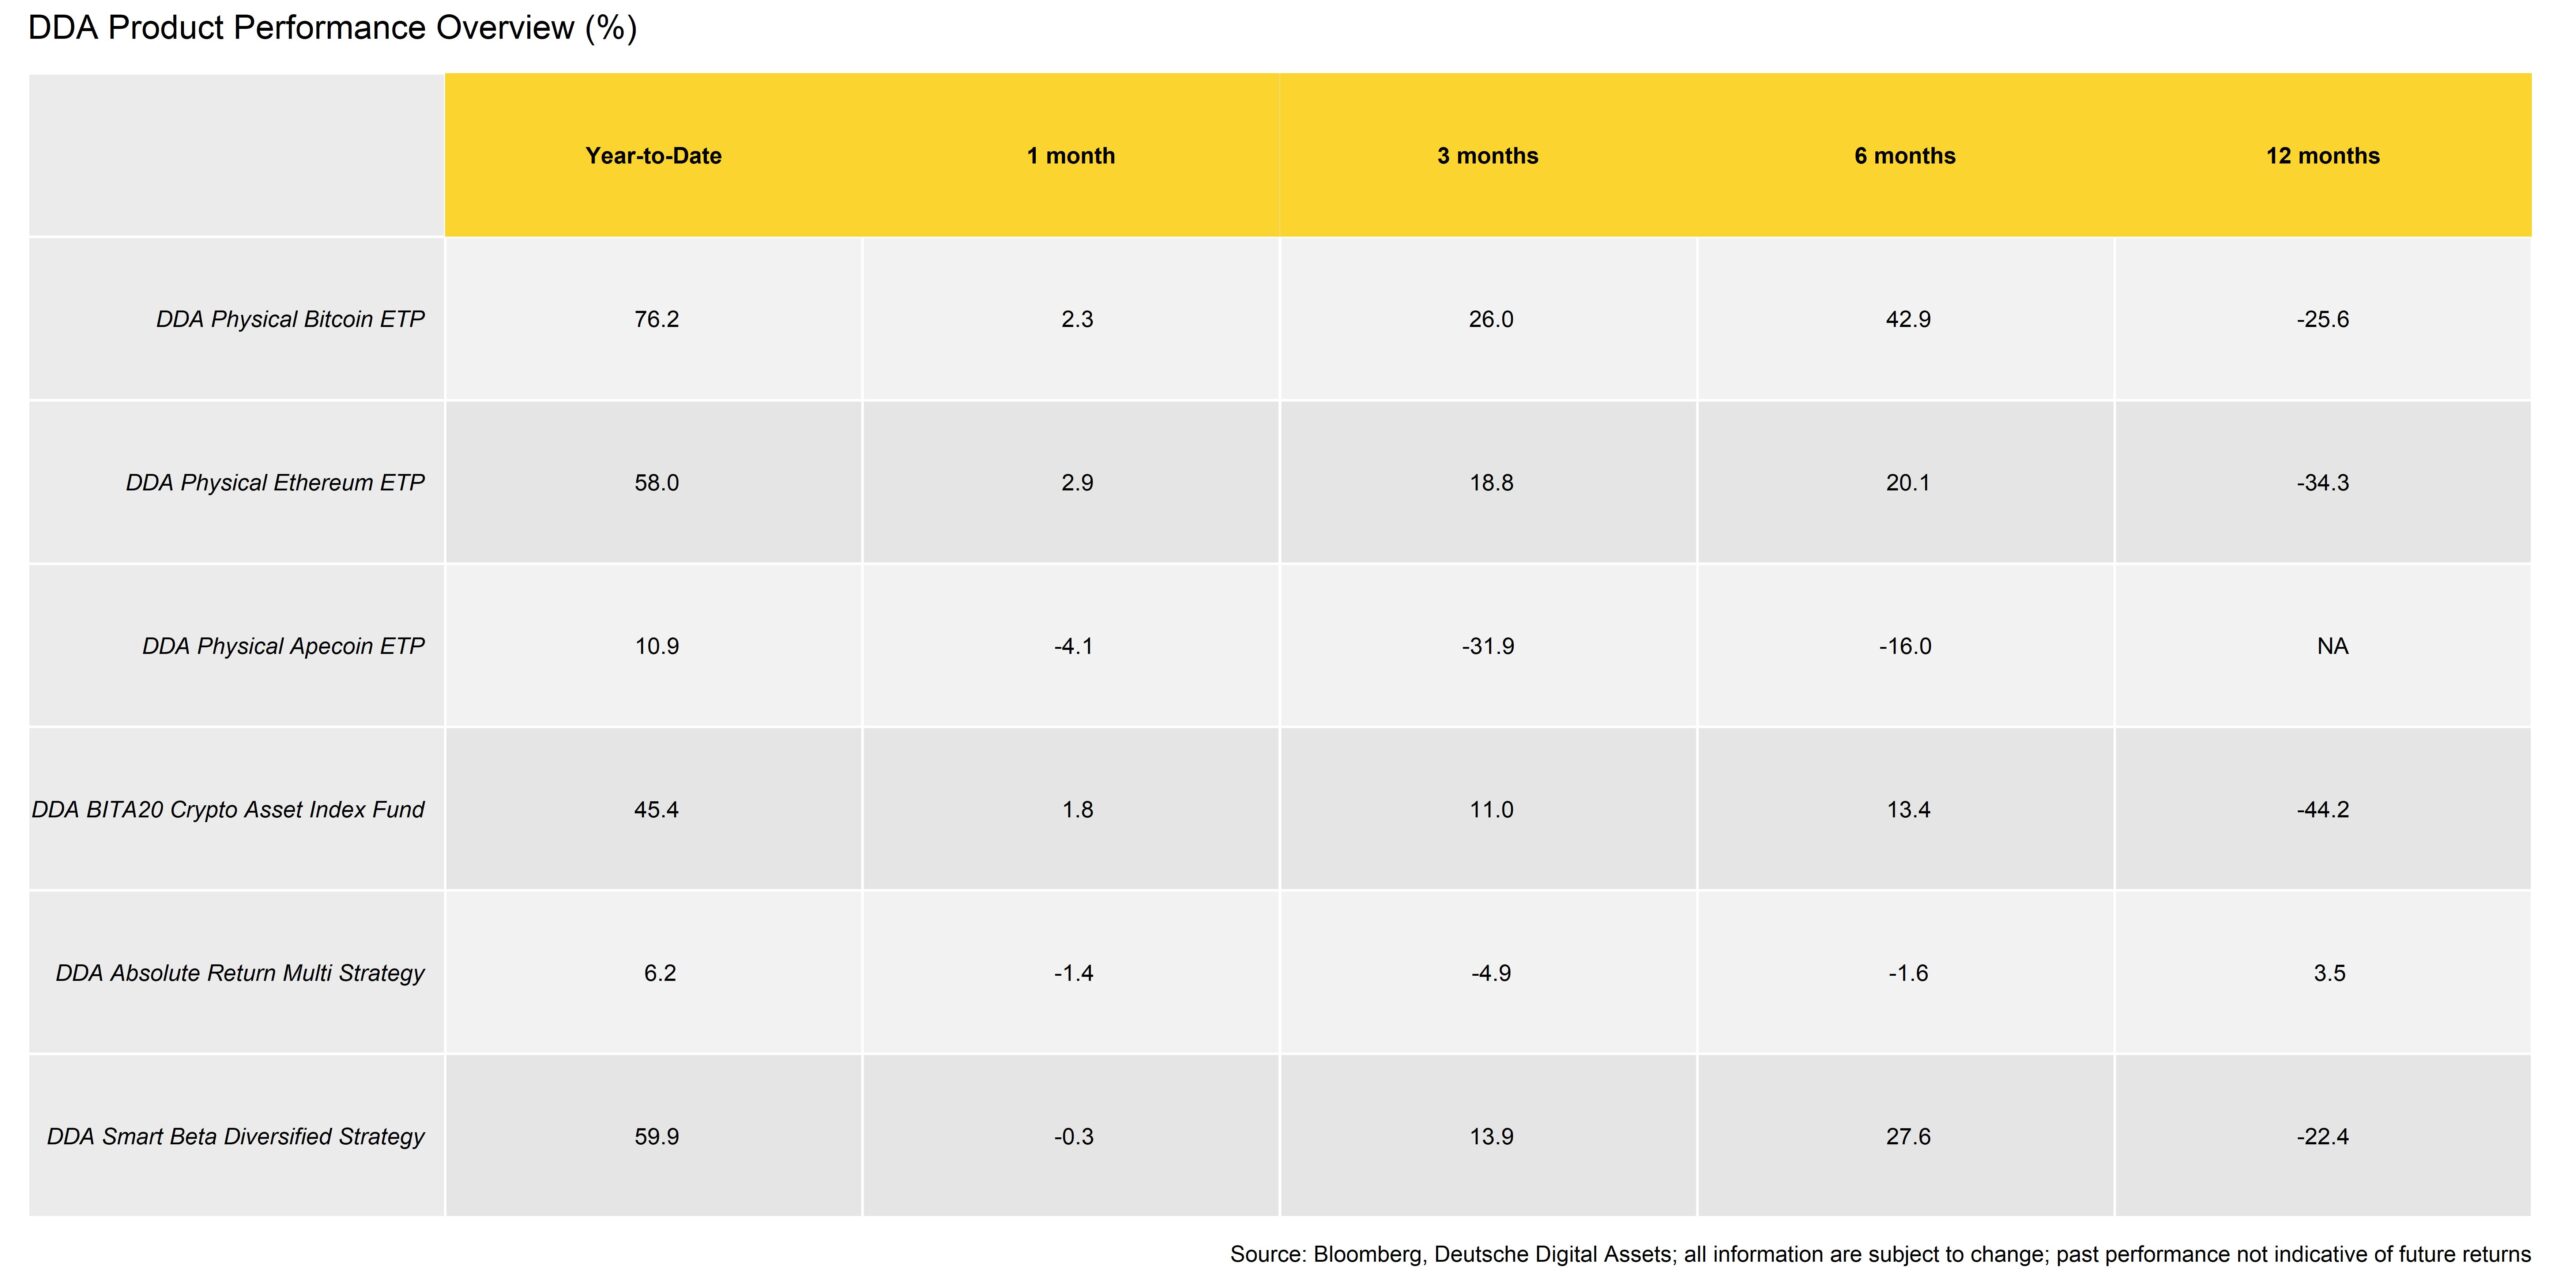
Während die Bitcoin- und Ethereum-ETPs sehr gut abschnitten, entwickelte sich der Apecoin-ETP unterdurchschnittlich. Grund dafür ist die allmähliche Freigabe der Token, die in den kommenden Monaten aufgrund des spezifischen Ausübungsplans erfolgen wird, der es den frühen Entwicklern von Yuga Labs, der Wohltätigkeitsorganisation und den Gründern ermöglicht, ihre Token zu verteilen. Dies hat höchstwahrscheinlich einen gewissen Abwärtsdruck auf den Preis ausgeübt.
Darüber hinaus funktionierte die Alpha-Strategie in der ersten Monatshälfte gut, litt aber unter den chaotischen Bewegungen der letzten zehn Tage, insbesondere bei den kurzfristigen Strategien. Auch das Beta-Programm schnitt am Ende des Monats schlechter ab und wurde von Momentum-Strategien bestraft, die ein erhebliches Engagement in Altcoins hatten, die noch stärker korrigierten.
Im Allgemeinen waren unter den 10 wichtigsten Kryptoassets Solana, BNB und Dogecoin die wichtigsten Outperformer. Solana wurde durch zahlreiche positive Entwicklungen im Ökosystem und einen starken Anstieg des offenen Interesses an Derivaten gestärkt. BNB entwickelte sich vor allem aufgrund des Starts des Binance-Launchpool-Projekts Sui farming positiv, während die Performance von Dogecoin durch die Aufregung im Bereich der Meme-Coins aufgrund des Starts von Pepe Coin im April angekurbelt wurde.
Nach dem erfolgreichen Ethereum Shapella Upgrade am 12.th des Monats April sahen wir einen deutlichen Anstieg der Altcoin-Outperformance gegenüber Bitcoin, die jedoch bis zum Monatsende allmählich wieder abflaute. Im April schafften es nur 10% der erfassten Altcoins, Bitcoin zu übertreffen, während es nur wenige Tage nach dem Ethereum-Upgrade eine Outperformance von 45% gab.
Die Streuung der Wertentwicklung von Krypto-Assets hat im April deutlich zugenommen, wobei die Aufwertung von Ethereum Shapella der Hauptauslöser war. Eine Zunahme der Streuung bedeutet, dass die Wertentwicklung von Kryptoassets zunehmend von münzspezifischen Faktoren im Gegensatz zu systematischen Faktoren bestimmt wird.
Unterm Strich: Kryptoassets verzeichneten im April eine weitere positive Performance aufgrund des erfolgreichen Ethereum Shapella-Upgrades und der anhaltend hohen Netzwerkaktivität für Bitcoin aufgrund der Einschreibe-Saga.
Kommentar zu Makro & Märkte
Eines der vorherrschenden Themen auf der makroökonomischen Seite war, dass die Risiken für die US-Staaten angesichts der drohenden Schuldenobergrenze weiter gestiegen sind. Die meisten Schätzungen gehen davon aus, dass dem US-Finanzministerium im Juli dieses Jahres die Barmittel ausgehen werden, was zu einem technischen Zahlungsausfall führen könnte, wenn die USA eine Kupon- oder Fälligkeitszahlung für ihre Schulden versäumen. Zum Zeitpunkt der Erstellung dieses Berichts verfügt das Treasury General Account (TGA) bei der Fed noch über ein Guthaben von 166,5 Mrd. USD, das jedoch in diesem Jahr monatlich um etwa -64 Mrd. USD schrumpft.
Das ist auch der Grund, warum die Händler begonnen haben, die Kreditausfallversicherungen für die USA in die Höhe zu treiben. Zum Zeitpunkt der Erstellung dieses Berichts sind die 1-Jahres-CDS für die USA auf 177 Basispunkte gestiegen - der höchste Stand aller Zeiten. Geht man von einer theoretischen Erholungsrate von 40% im Falle eines Ausfalls aus, so bedeutet ein CDS-Satz von 177 bps eine Ausfallwahrscheinlichkeit von 2,95% in einem Jahr. Das ist zwar immer noch relativ niedrig, aber sowohl die 1-Jahres-CDS als auch die 5-Jahres-CDS der USA haben begonnen, sehr schnell zu steigen.
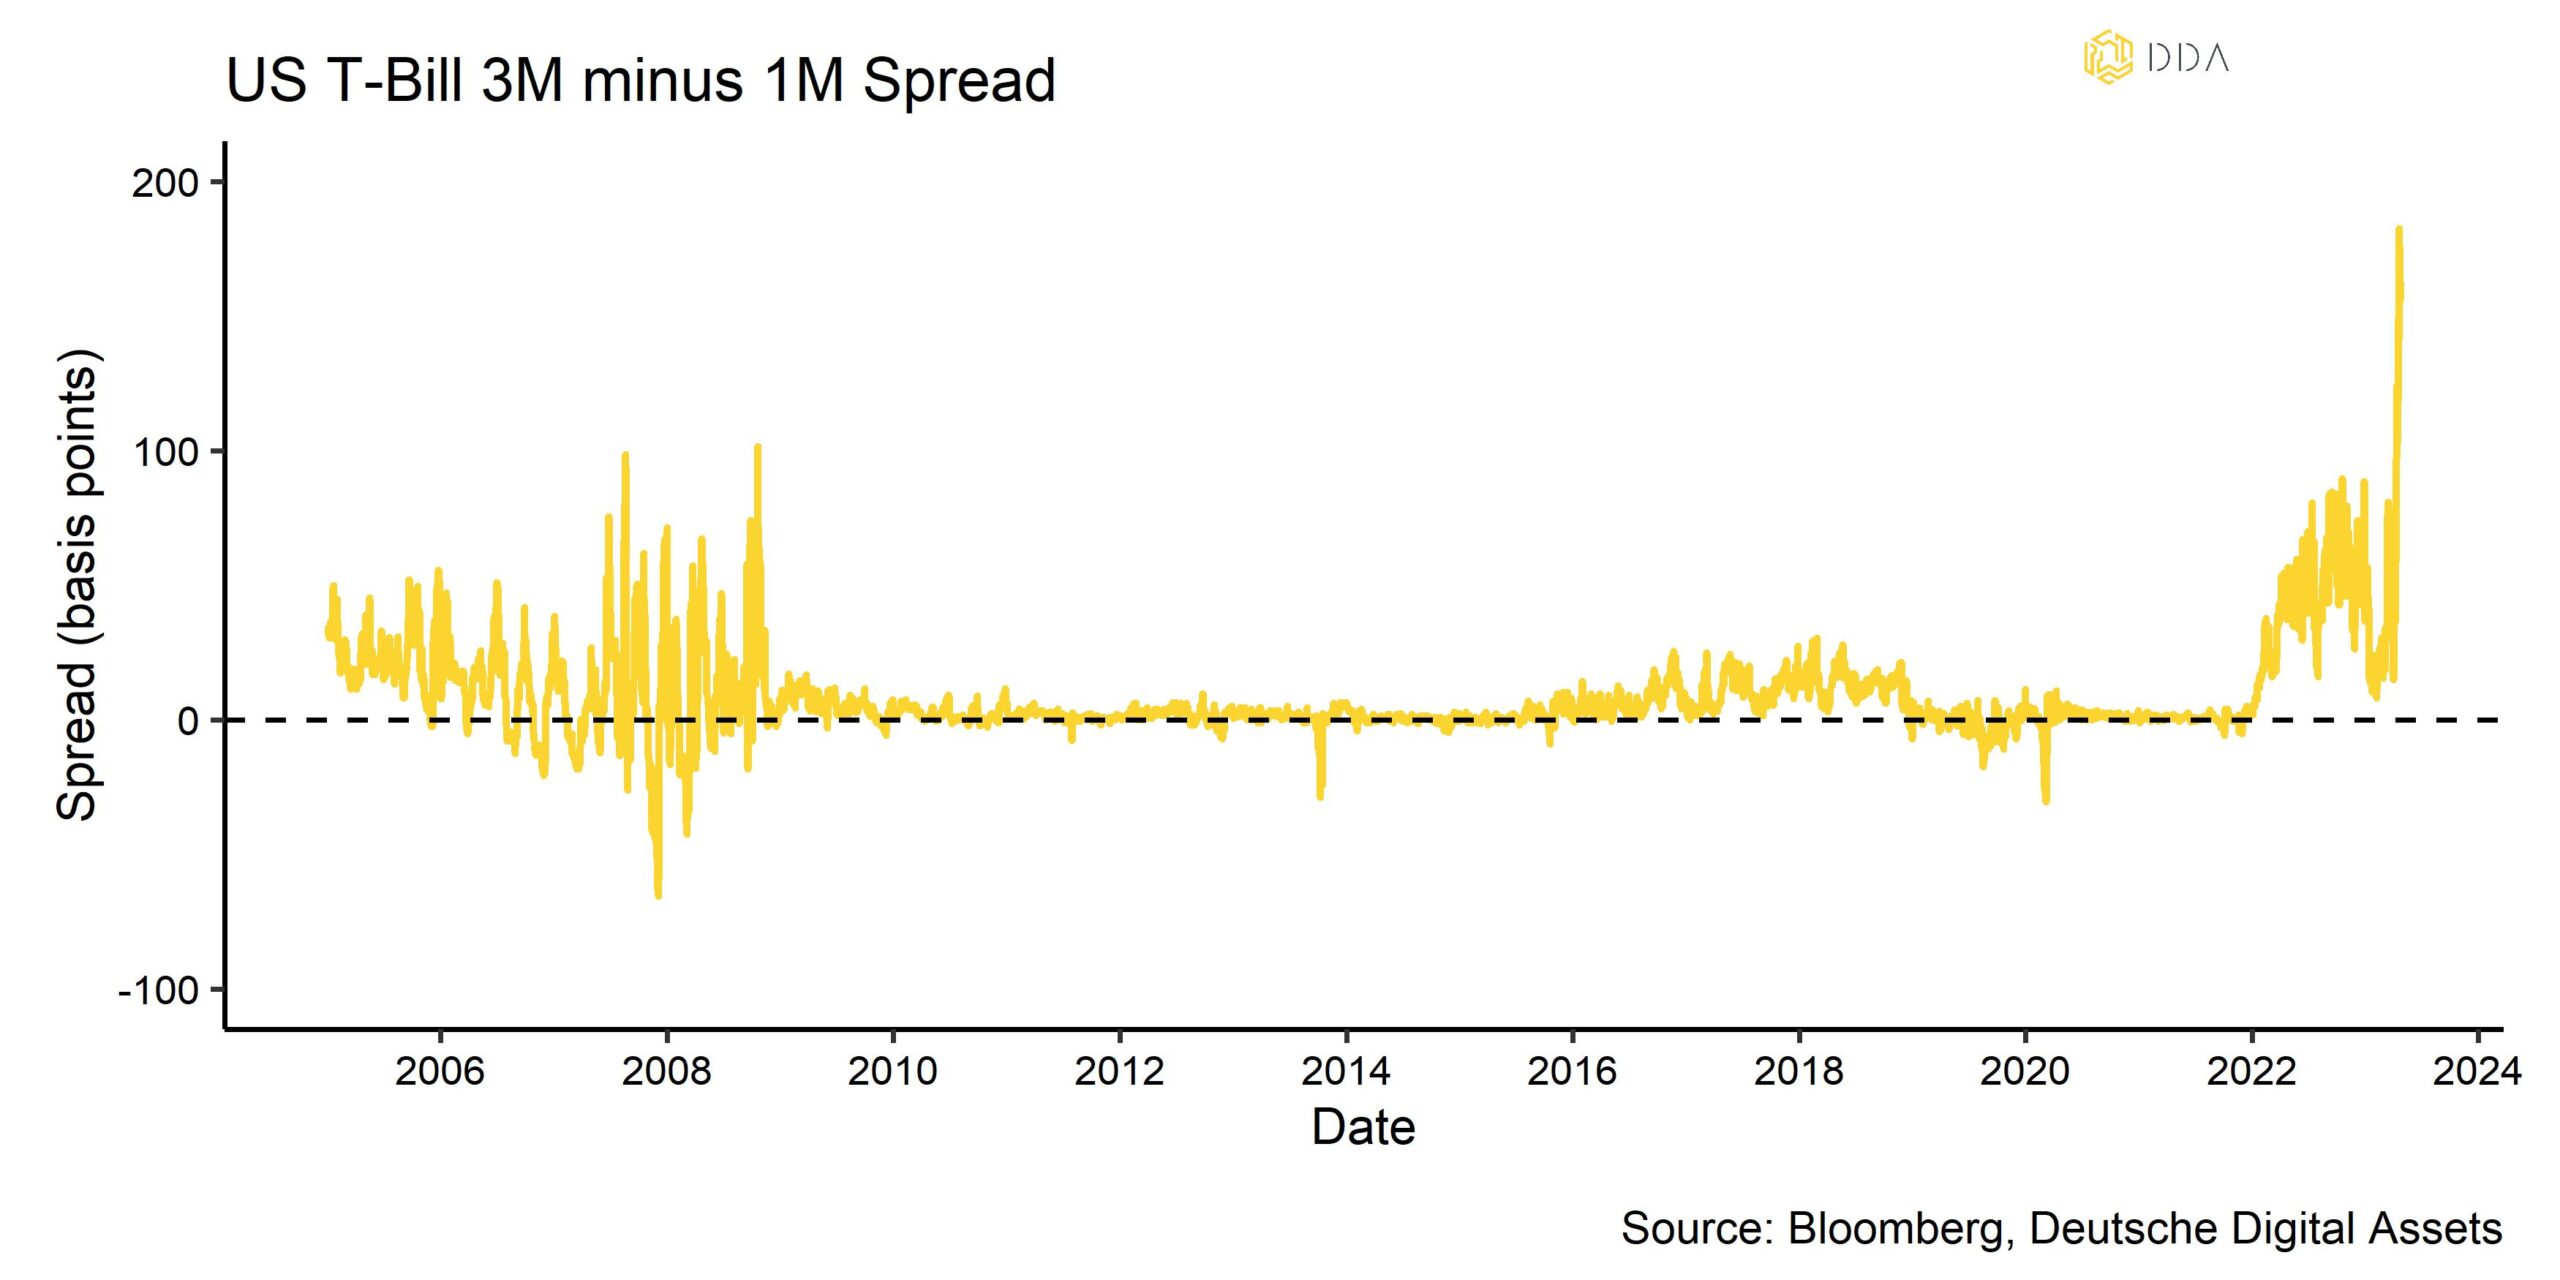
Dies hat auch zu einigen Verzerrungen am vorderen Ende der US-Schatzkurve geführt, wobei der Spread zwischen 3-Monats- und 1-Monats-T-Bills so hoch ist wie nie zuvor. Dies steht im Widerspruch zu den angekündigten Zinserhöhungen der US-Notenbank, die sich in den Renditen kürzerer T-Bills wie dem 1-Monats-T-Bill stärker bemerkbar machen sollten, und ist mit Sicherheit auf die zunehmende Risikoscheu der Anleiheinvestoren angesichts der Schuldenobergrenze zurückzuführen, die 3-Monats-T-Bills zugunsten von 1-Monats-T-Bills meiden, aber auch auf die Tatsache, dass das US-Finanzministerium in letzter Zeit die Ausgabe von 1-Monats-T-Bills eingeschränkt hat.
In diesem Zusammenhang gibt es zunehmende Bedenken hinsichtlich des US-Dollars und einer möglichen "Entdollarisierung", d.h. strategische Veräußerungen von auf Dollar lautenden Vermögenswerten durch ausländische Unternehmen und Staaten.
Im Allgemeinen wurde das Narrativ der De-Dollarisierung auch durch die politischen Entwicklungen in den BRICS-Ländern unterstützt, die beschlossen, den bilateralen Handel in anderen Währungen als dem US-Dollar zu denominieren, sowie durch die Tatsache, dass die jüngsten Goldkäufe der Zentralbanken die höchsten seit 1967 waren. Gold gilt unter den traditionellen Finanzmarktteilnehmern nach wie vor als "Anti-Dollar".
Der Anteil des US-Dollars an den weltweiten Devisenreserven liegt Ende 2022 immer noch bei 58,3%, während die Zuweisungen an konkurrierende Währungen wie den chinesischen Yuan mit 2,3% Ende 2022 immer noch relativ gering sind. Nichtsdestotrotz ist der Trend der De-Dollarisierung in den Daten deutlich erkennbar:
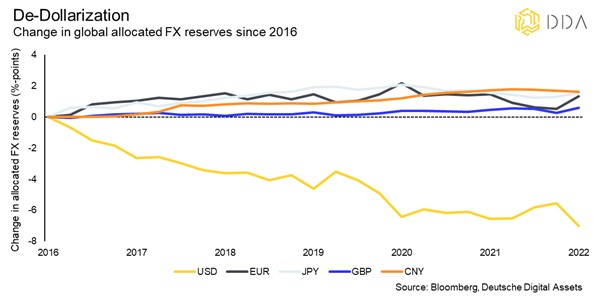
Der Anteil des US-Dollars an den weltweit zugewiesenen Devisenreserven ist seit 2016 um mehr als 7%-Punkte gesunken, während der Anteil der anderen wichtigen Währungen gestiegen ist.
Die De-Dollarisierung ist jedoch ein struktureller Prozess, der sich über mehrere Jahrzehnte erstreckt und nicht über Nacht stattfindet. Eine Umkehr der US-Geldpolitik und strukturell höhere Zinssätze in Europa und anderen Regionen könnten jedoch eine strukturelle Abwanderung internationaler Aktien- und Anleiheportfolios aus den USA bewirken, was die De-Dollarisierung auch aus zyklischer Sicht beschleunigen könnte.
Apropos US-Dollar: Unser hauseigenes Makrofaktormodell, das die Sensitivität und Erklärungskraft verschiedener Makrofaktoren für Bitcoin misst, zeigt im April eine zunehmende Sensitivität von Bitcoin gegenüber dem Faktor US-Dollar und dem Faktor Geldpolitik.
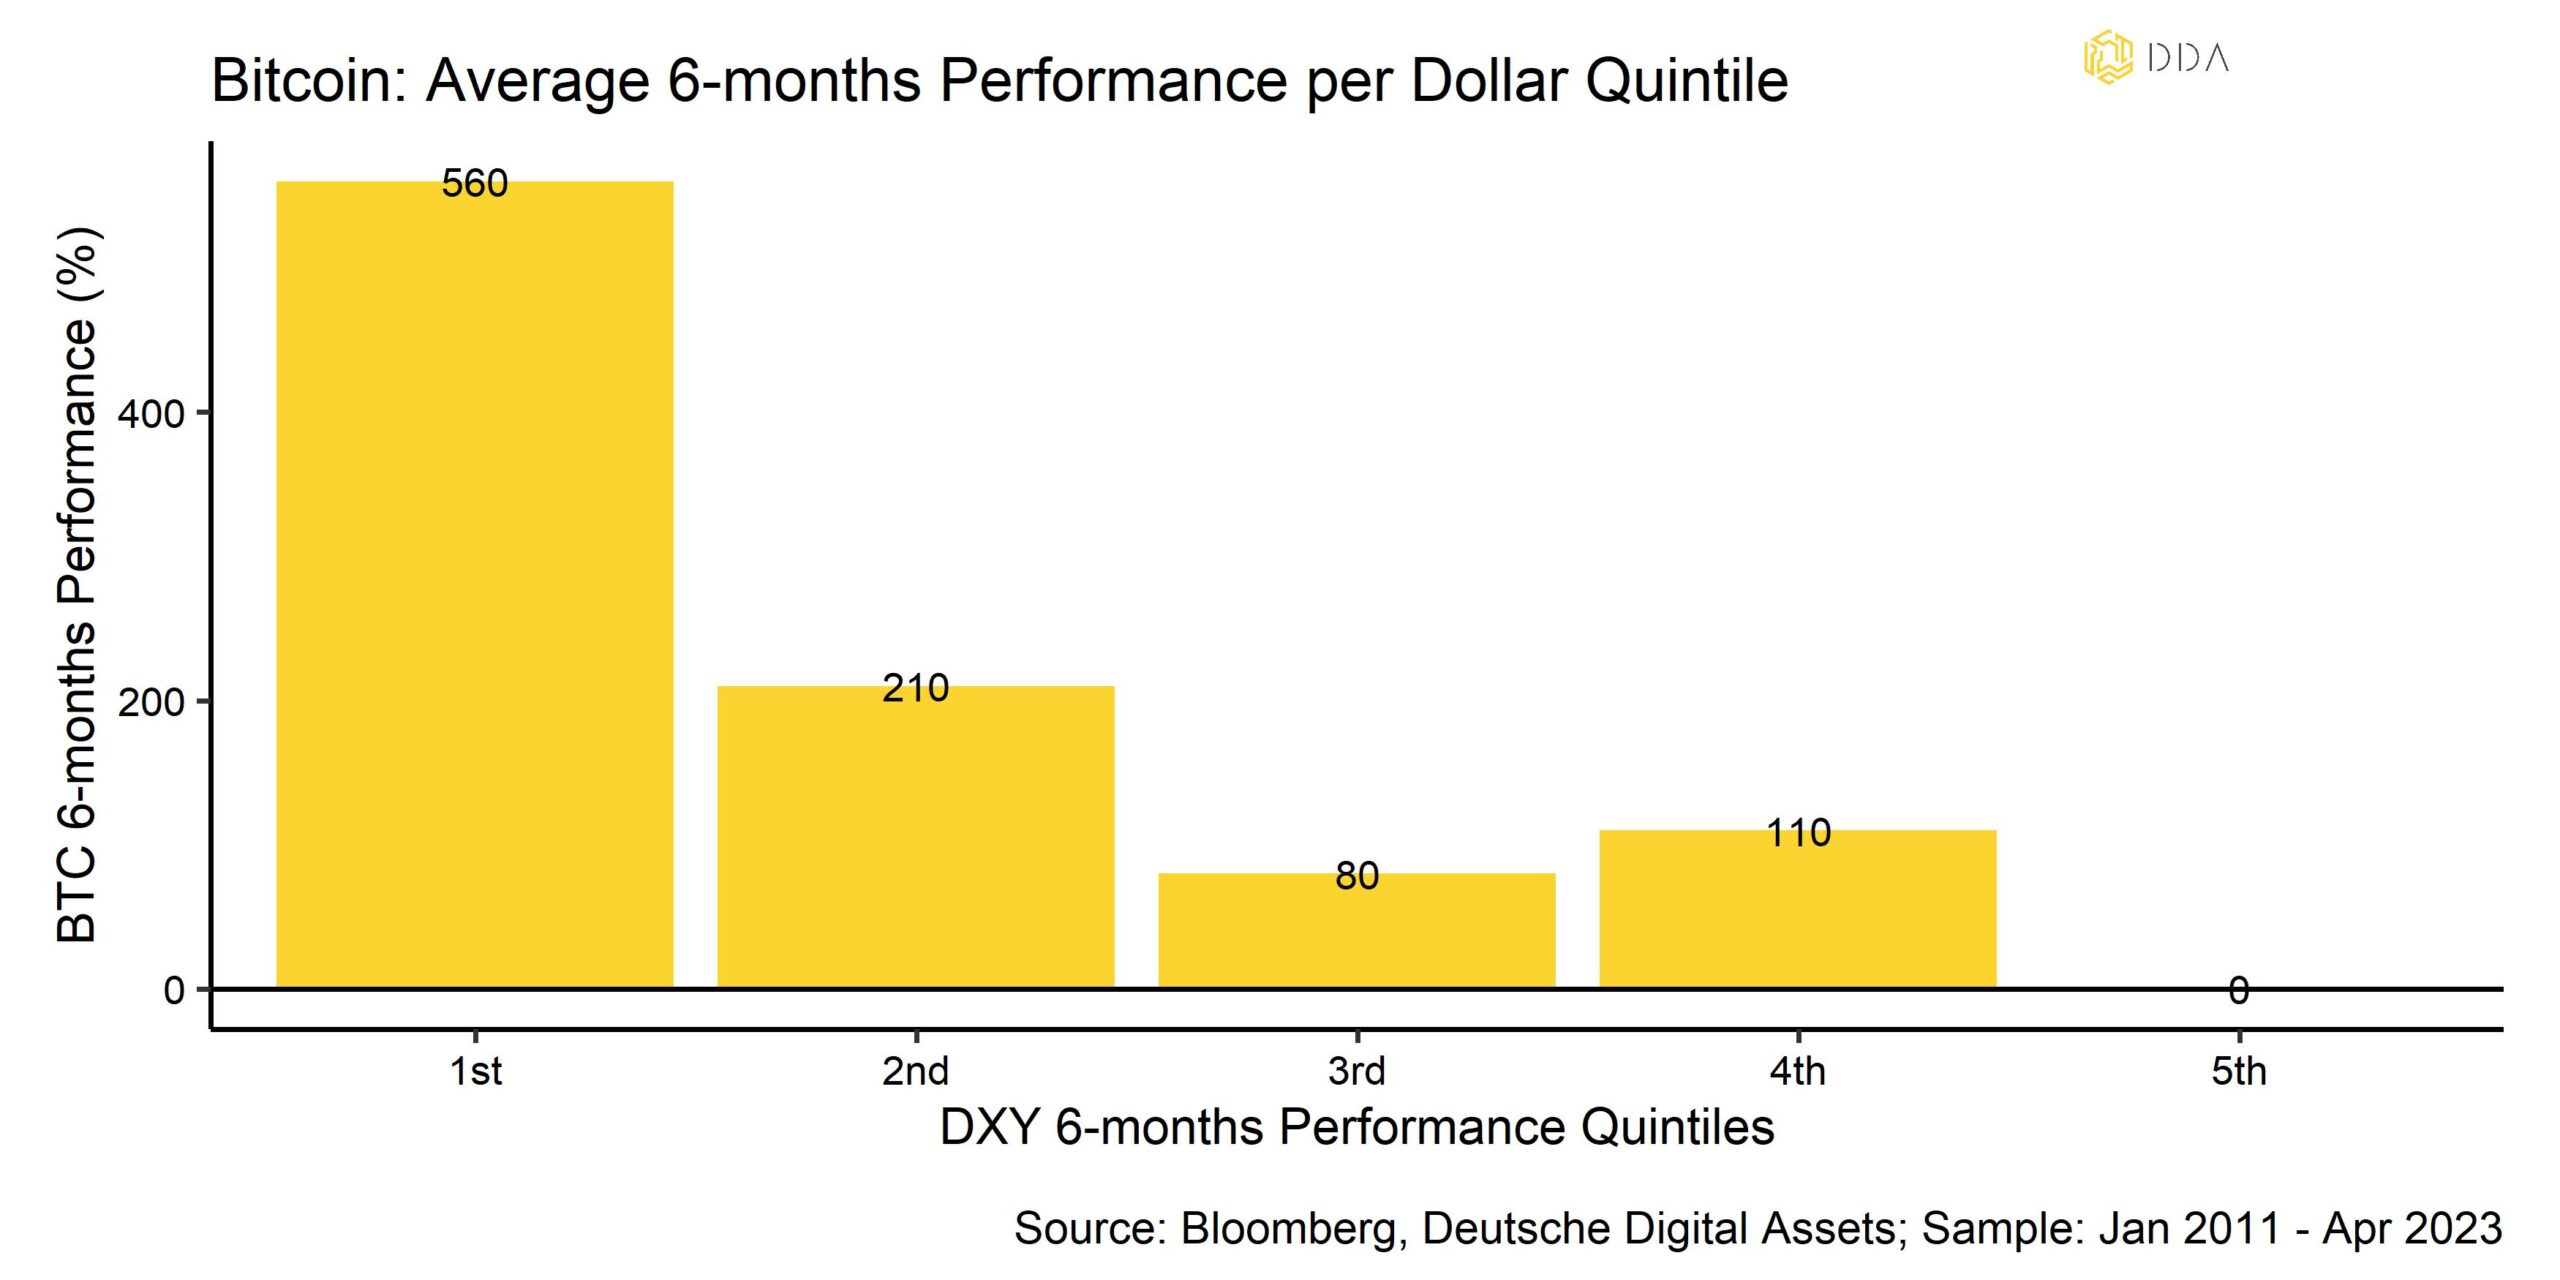
Diese beiden Makrofaktoren sind nun die wichtigsten Faktoren für die Bitcoin-Preisschwankungen. Bitcoin-Preisschwankungen scheinen nun besonders empfindlich auf Veränderungen des Makrofaktors US-Dollar zu reagieren (siehe Anhang). Die rollierende 60-Tage-Korrelation zwischen BTC und dem Dollar-Index (DXY) hat weiter zugenommen, ist aber immer noch negativ, was bedeutet, dass eine Abwertung des Dollars in den letzten 60 Tagen mit steigenden Bitcoin-Kursen verbunden war.Wir bekräftigen unseren Standpunkt, dass eine strukturelle Schwäche des US-Dollars für die Preise von Kryptowährungen und insbesondere für Bitcoin als alternative globale Reservewährung sehr positiv wäre. Dies wird auch in der folgenden Tabelle deutlich, die die Bitcoin-Performance in Abhängigkeit von der Entwicklung des Dollar-Index (DXY) zeigt. Die höchsten Bitcoin-Performances wurden in der Vergangenheit in Zeiten einer deutlichen Dollar-Schwäche beobachtet (1st DXY-Leistungsquintil):
Gleichzeitig ist der unerklärte Anteil der Bitcoin-Preisschwankungen ("Rest") allmählich zurückgegangen und liegt nun unter 50%. Der hohe Prozentsatz an Preisschwankungen, der nicht durch Makrofaktoren erklärt werden kann, ist höchstwahrscheinlich auf den Anstieg von Inskriptionen und münzspezifischen Netzwerkaktivitäten zurückzuführen.
Die jüngsten aggressiven Äußerungen von FOMC-Mitgliedern, die auf eine weitere Zinserhöhung um 25 Basispunkte im Mai hindeuten, haben die Abwanderung von Geldern aus Bankeinlagen in Geldmarktfonds weiter gefördert. Es hat den Anschein, dass das Szenario "was auch immer es kaputt macht" immer noch im Spiel ist, d.h. die Fed wird so lange an der Zinsschraube drehen, bis die finanzielle Instabilität wieder auftaucht. Allerdings erwartet der Markt derzeit, dass die Fed im Mai eine letzte Zinserhöhung vornimmt und anschließend bis zum Jahresende eine Senkung um 25 Basispunkte vornimmt. Die Wahrscheinlichkeit, dass etwas "kaputt geht", wird mit dem weiteren Austrocknen der Dollar-Liquidität zwangsläufig steigen. Anekdotische Hinweise auf eine akute Dollarknappheit in Entwicklungsländern wie Argentinien oder Ägypten verstärken die Sorge, dass die Liquidität weltweit immer noch knapp ist.
Die Erträge und Umsätze regionaler Banken wie der First Republic Bank (FRBK) haben in letzter Zeit die Erwartungen nicht erfüllt und könnten ein Zeichen für anhaltende Risiken im Bankensektor sein, da die FRBK höhere Einlagenabflüsse als erwartet meldete. Es gibt auch einige Anzeichen dafür, dass die Schwäche des Aktienkurses der FRBK die jüngste kurzfristige Erholung der Kryptoasset-Preise wieder unterstützt hat. Am Wochenende hat die US-Regierung mit JP Morgan eine Rettungsaktion für FRBK ausgehandelt. Die Bankenpleite von FRBK ist auch eine der größten in der Finanzgeschichte der USA.
Jüngste Daten der Zentralbank deuten darauf hin, dass sich der Stress im Bankensektor zwar stabilisiert hat, aber noch nicht völlig abgeklungen ist, wenn man die jüngste Inanspruchnahme des BTFP und des Diskontfensters der Fed durch die Geschäftsbanken betrachtet.
Nichtsdestotrotz übertreffen die globalen Wachstumsaussichten außerhalb der USA weiterhin die Erwartungen, was höchstwahrscheinlich auf die anhaltende Beschleunigung des chinesischen Wachstums zurückzuführen ist. In diesem Zusammenhang könnten die jüngsten positiven Gewinnüberraschungen von US-Großunternehmen auch auf diesen Faktor zurückzuführen sein, da die meisten US-Großunternehmen im Allgemeinen ein hohes internationales Umsatzvolumen aufweisen.
In der Zwischenzeit haben regionale Umfragen der Fed und andere Frühindikatoren größtenteils bestätigt, dass sich die US-Wirtschaft weiterhin abschwächt. Ein US-Rezessionsmodell der New Yorker Fed signalisiert mit 57,8% Wahrscheinlichkeit, dass die US-Wirtschaft in den nächsten 12 Monaten in eine Rezession eintreten wird - die höchste Wahrscheinlichkeit seit 1982. Eine Rezession scheint "in den Kuchen hineingebacken" zu sein und ist auch Konsens unter den von Bloomberg befragten Wirtschaftswissenschaftlern, die die mittlere Rezessionswahrscheinlichkeit bei 65% sehen.
Die Rezessionserzählung in den USA dürfte allmählich als Gegenwind für die Aktien- und Kryptomärkte nachlassen, da die Aktienmärkte historisch gesehen ihren Tiefpunkt erreichen, wenn Frühindikatoren wie die ISM-Umfrage für das verarbeitende Gewerbe durchlaufen.
Mehr noch, eine weitere Konjunkturschwäche und ein schwacher US-Arbeitsmarkt dürften die US-Notenbank unter Druck setzen, ihre Straffungsbemühungen zu unterbrechen und letztlich einen neuen geldpolitischen Lockerungszyklus einzuleiten, was den Kryptoassets in Zukunft erheblichen Rückenwind verleihen würde.
Unterm Strich: An der Makrofront stehen die zunehmenden Risiken für die US-Staaten im Hinblick auf die Schuldenobergrenze und die De-Dollarisierung im Vordergrund. Eine signifikante Dollarschwäche wäre ein starker Rückenwind für Kryptoassets, insbesondere Bitcoin.
Die Rezessionserzählung in den USA dürfte allmählich als Gegenwind verblassen, da sie derzeit "in den Kuchen hineingebacken" zu sein scheint und die Aktienmärkte in der Vergangenheit ihren Tiefpunkt bei den Frühindikatoren erreicht haben, was sich ebenfalls positiv auf die Kryptowährungsmärkte auswirken würde. Eine weitere wirtschaftliche Schwäche würde auch die Fed unter Druck setzen, eine Pause einzulegen und schließlich einen neuen Lockerungszyklus einzuleiten, was ein erheblicher Rückenwind für die Kryptoasset-Preise wäre.
On-Chain-Analytik
Das wahrscheinlich größte Ereignis im April aus der On-Chain-Perspektive war das Shapella-Upgrade des Ethereum-Netzwerks, das am 12.04.2023 stattfand.
Wir haben einen ausführlichen Artikel über die Vor- und Nachteile dieses Upgrades geschrieben, den Sie unbedingt lesen sollten, falls Sie dies noch nicht getan haben (siehe hier).
Das Upgrade selbst diente als Katalysator, um die unterdurchschnittliche Performance von Ethereum gegenüber Bitcoin kurz vor dem Upgrade im Jahr 2023 aufzuholen. Da die Derivatehändler nach dem erfolgreichen Upgrade ihre Absicherungen nach unten auflösten, konnte Ethereum die Performance von Bitcoin wieder übertreffen.
Aber das Ethereum-Upgrade diente auch als breiterer Katalysator für eine neue "Altsaison" - ein Marktumfeld, in dem Kryptowährungen außerhalb von Bitcoin beginnen, sich deutlich besser zu entwickeln als Bitcoin.
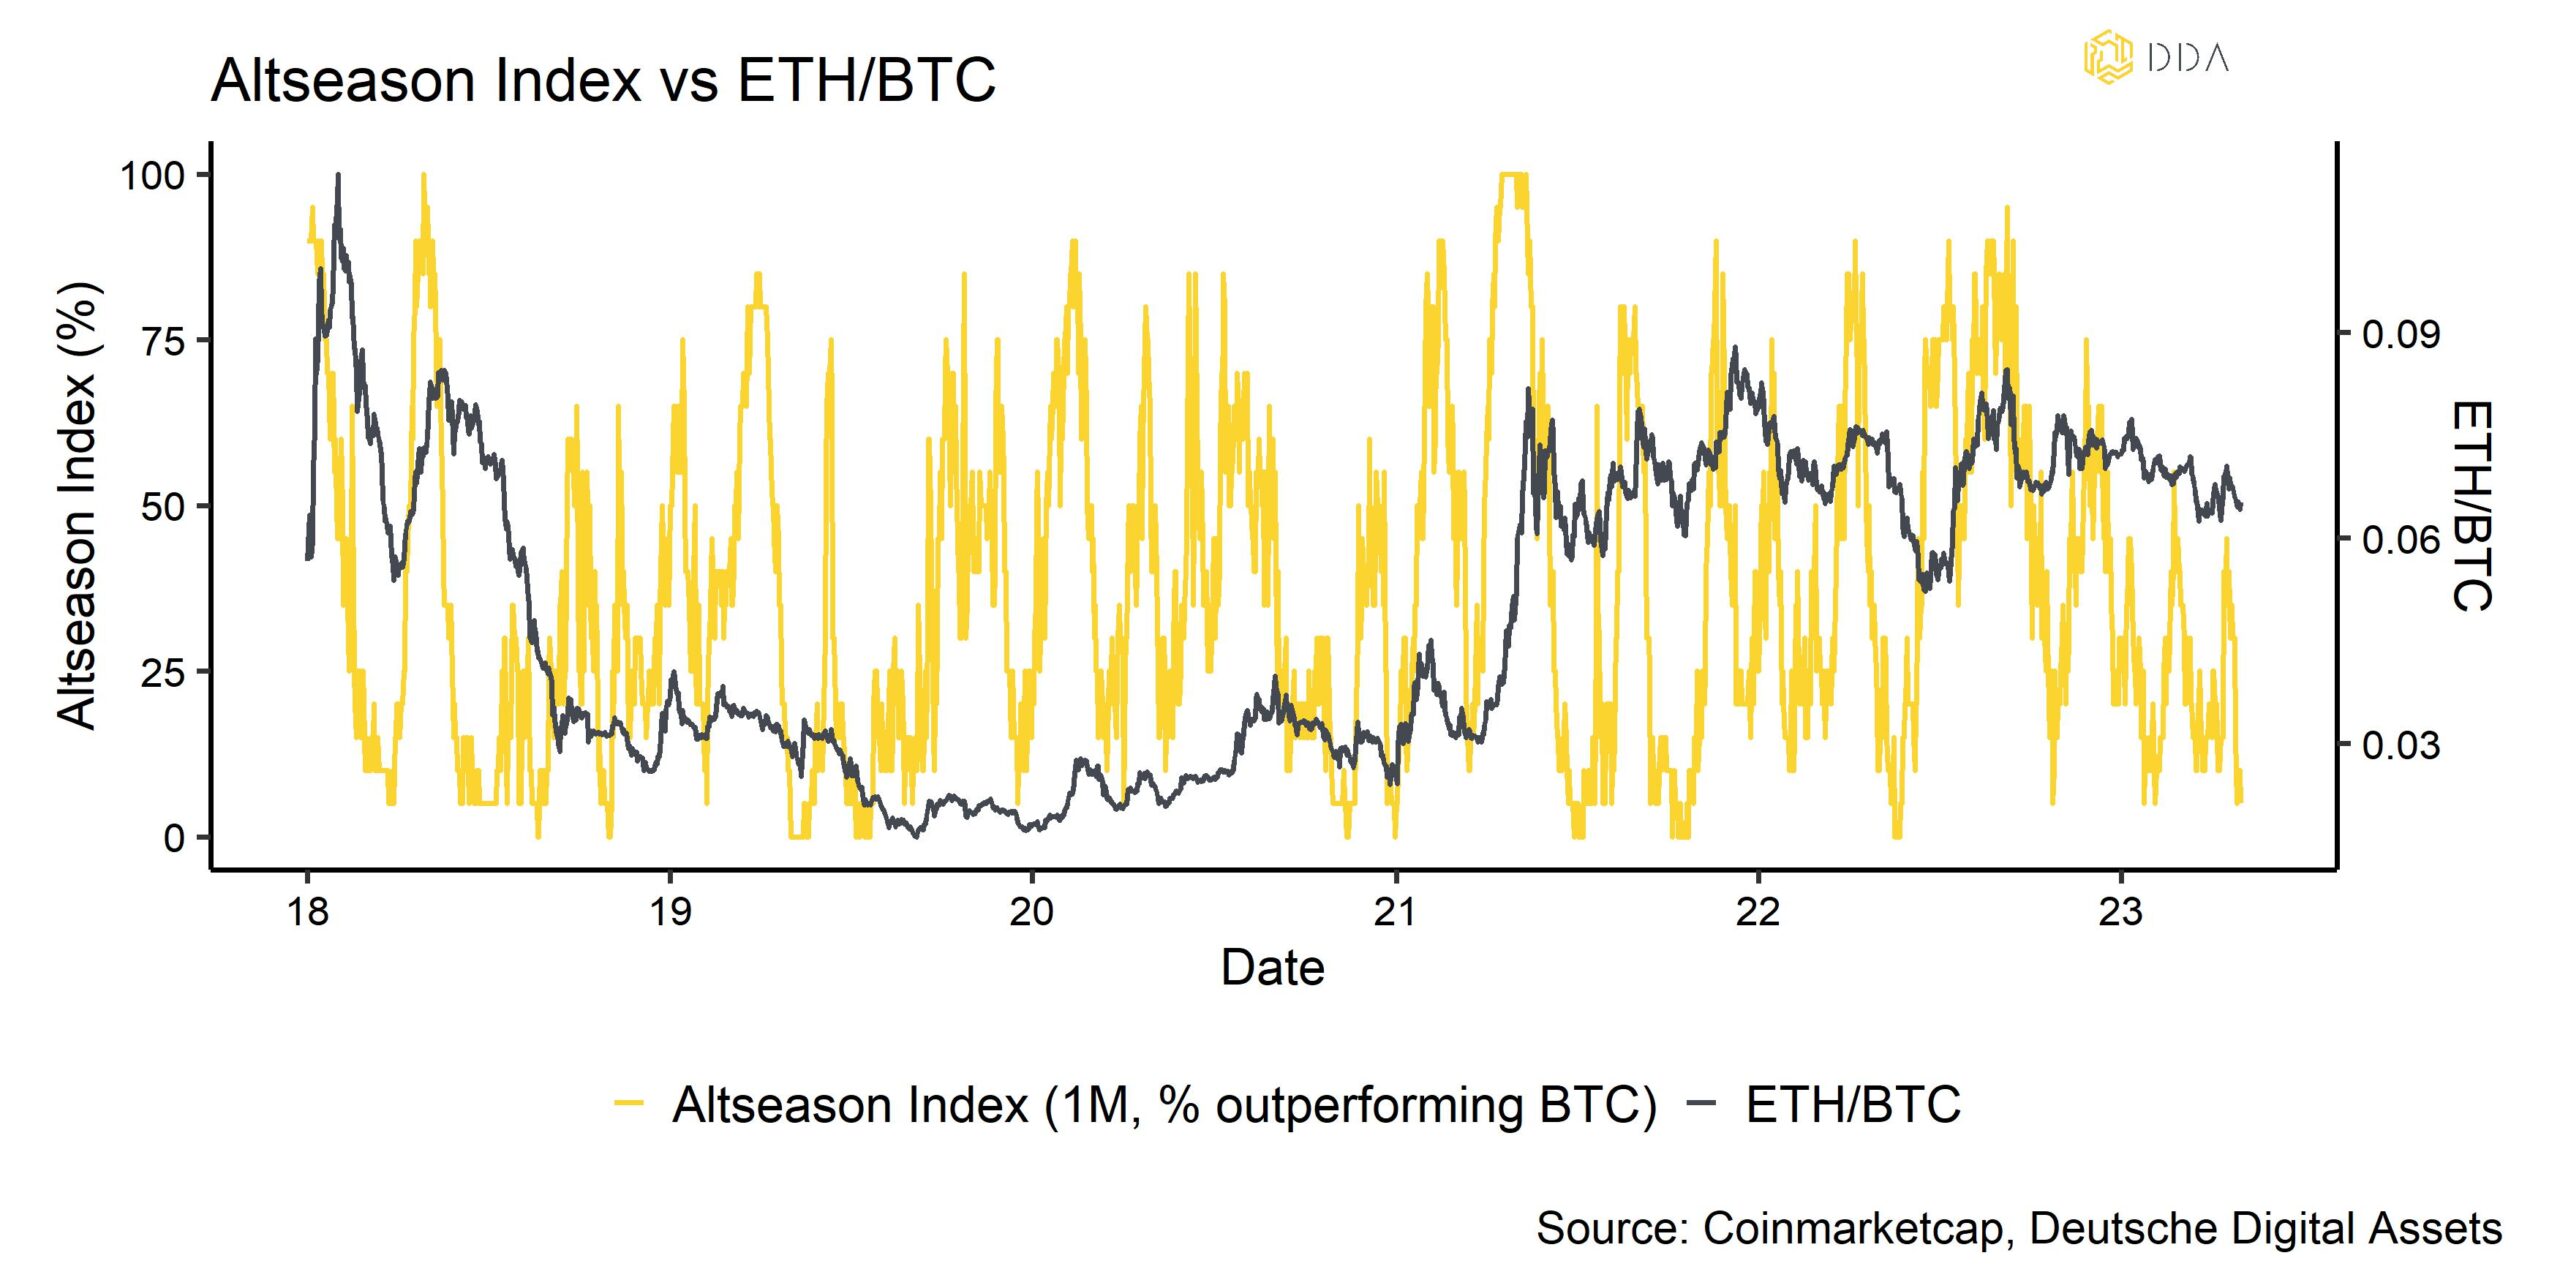
Das Jahr 2023 war bisher durch eine deutliche Outperformance von Bitcoin gekennzeichnet, aber wir haben erste Anzeichen dafür gesehen, dass diese Outperformance endet. Unmittelbar nach dem Upgrade signalisierte unser Altseason-Index, dass die Mehrheit der von uns verfolgten Altcoins in der Lage war, Bitcoin auf 1-Wochen-Basis zu übertreffen.
Gleichzeitig sind die Kernkennzahlen für Bitcoin auf der Bitcoin-Kette nach wie vor sehr solide, was die Kryptoasset-Märkte insgesamt auch in Zukunft unterstützen sollte.
So erreichte das gesamte Transfervolumen auf der Bitcoin-Blockchain am Wochenende ein neues Allzeithoch (siehe Chart des Monats). Mit anderen Worten, es gab noch nie so viele Transaktionen auf der Bitcoin-Blockchain wie jetzt. Die Tatsache, dass dies zu einer Zeit passiert, in der die US-Regierung eine Rettungsaktion für die First Republic Bank und JP Morgan vermittelt hat, ist wahrscheinlich nur ein lustiger Zufall.
Unser hauseigener Bitcoin-Netzwerkaktivitätsindex zeigt auch an, dass die gesamte Netzwerkaktivität auf der Basisschicht weiterhin auf dem Höchststand liegt, der während des letzten Bullenmarktes Mitte 2021 erreicht wurde.
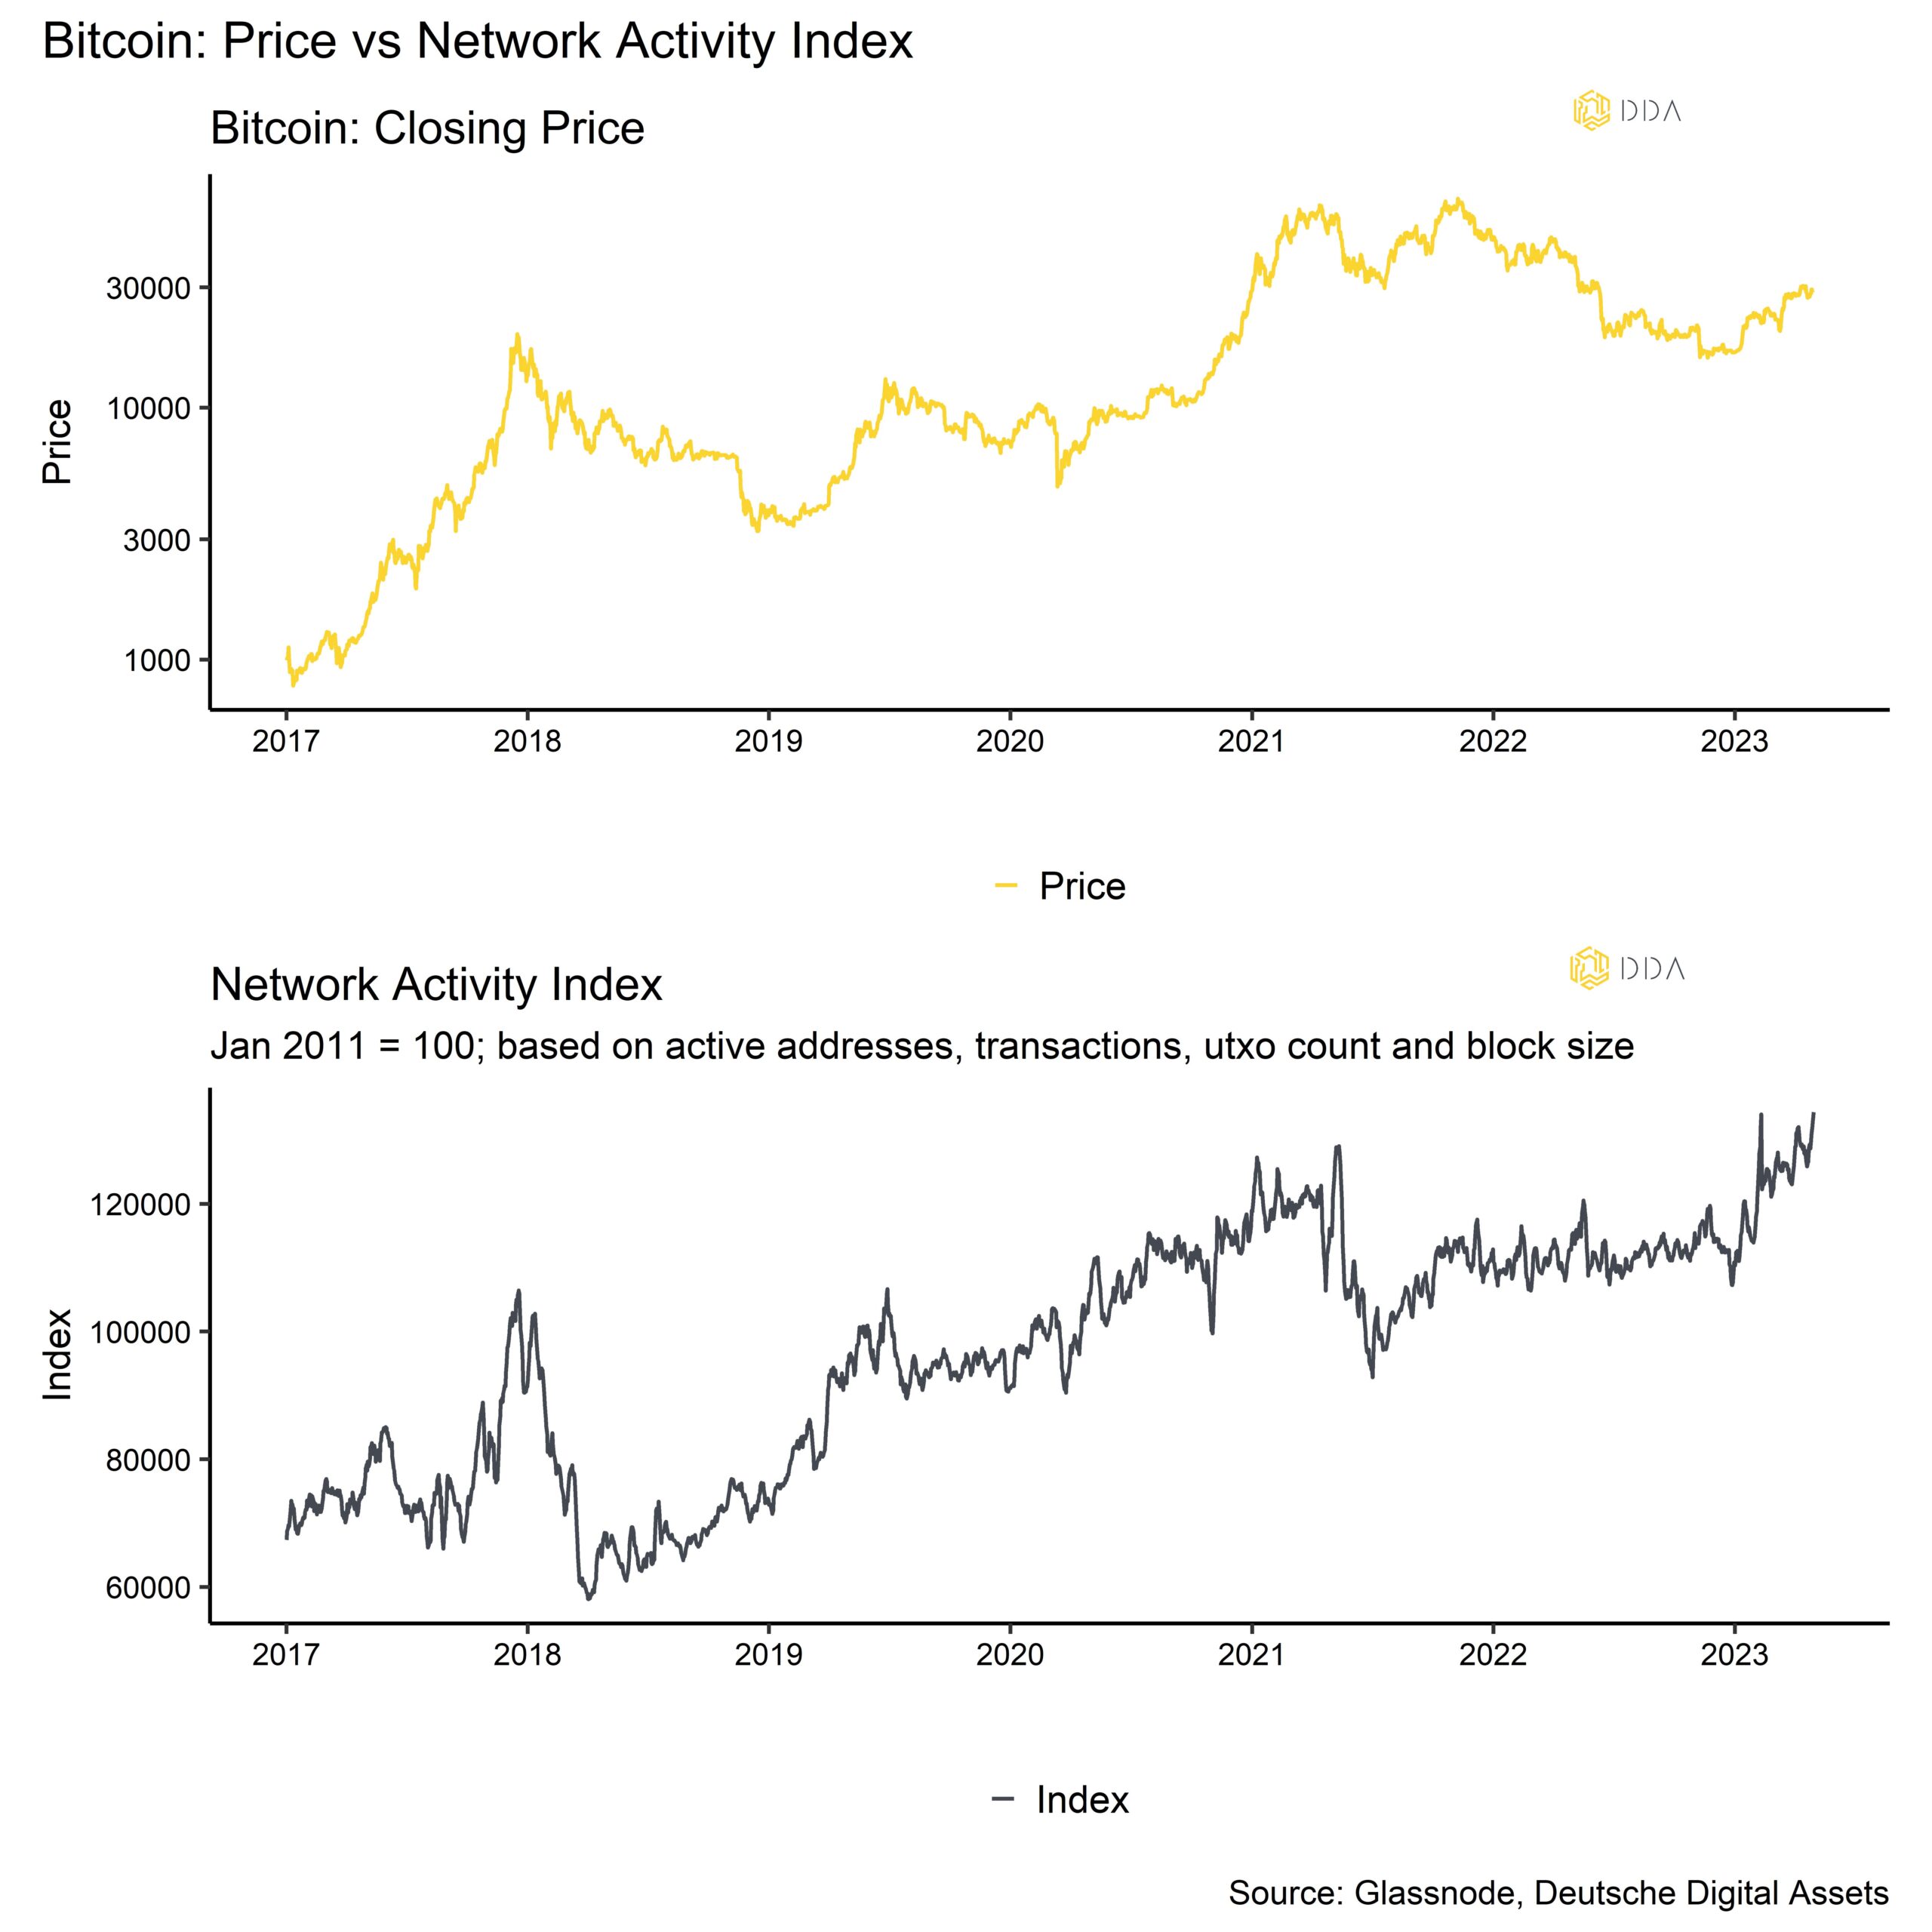
Einer der Gründe dafür ist, dass das Volumen der Inskriptionen immer noch zunimmt. Die tägliche Anzahl neuer Inskriptionen auf der Bitcoin-Blockchain erreichte am 24.04.23 mit fast 200.000 neuen Inskriptionen an einem einzigen Tag den höchsten jemals verzeichneten Stand. Die meisten dieser Inskriptionen waren Textinskriptionen, weshalb dies keinen signifikanten Einfluss auf die Blockgröße hatte.
Zum Zeitpunkt der Erstellung dieses Artikels haben etwa 1,7 Mio. Einschreibungen auf der Bitcoin-Blockchain stattgefunden, wobei die meisten dieser Einschreibungen laut den von Glassnode zusammengestellten Daten vom Typ Text (~1,05 Mio.) und Bild (~0,649 Mio.) sind.
Interessant ist, dass der jüngste Anstieg des Volumens der Inskriptionen durchschnittlich 40% aller Transaktionen (d. h. 4 von 10 Transaktionen enthielten eine Inskription), aber nur 20% des durchschnittlichen Anteils an der Blockgröße erreichte.
Im Gegensatz dazu war die Bitcoin-Akkumulation offenbar eher verhalten. Die Preisschwäche nach dem Zeitpunkt des Ethereum-Upgrades war höchstwahrscheinlich auch eine Folge davon. Tatsächlich fiel unsere interne Messung der gewichteten Akkumulationsaktivität über alle Bitcoin-Wallet-Kohorten hinweg auf den niedrigsten Stand seit Jahresbeginn.
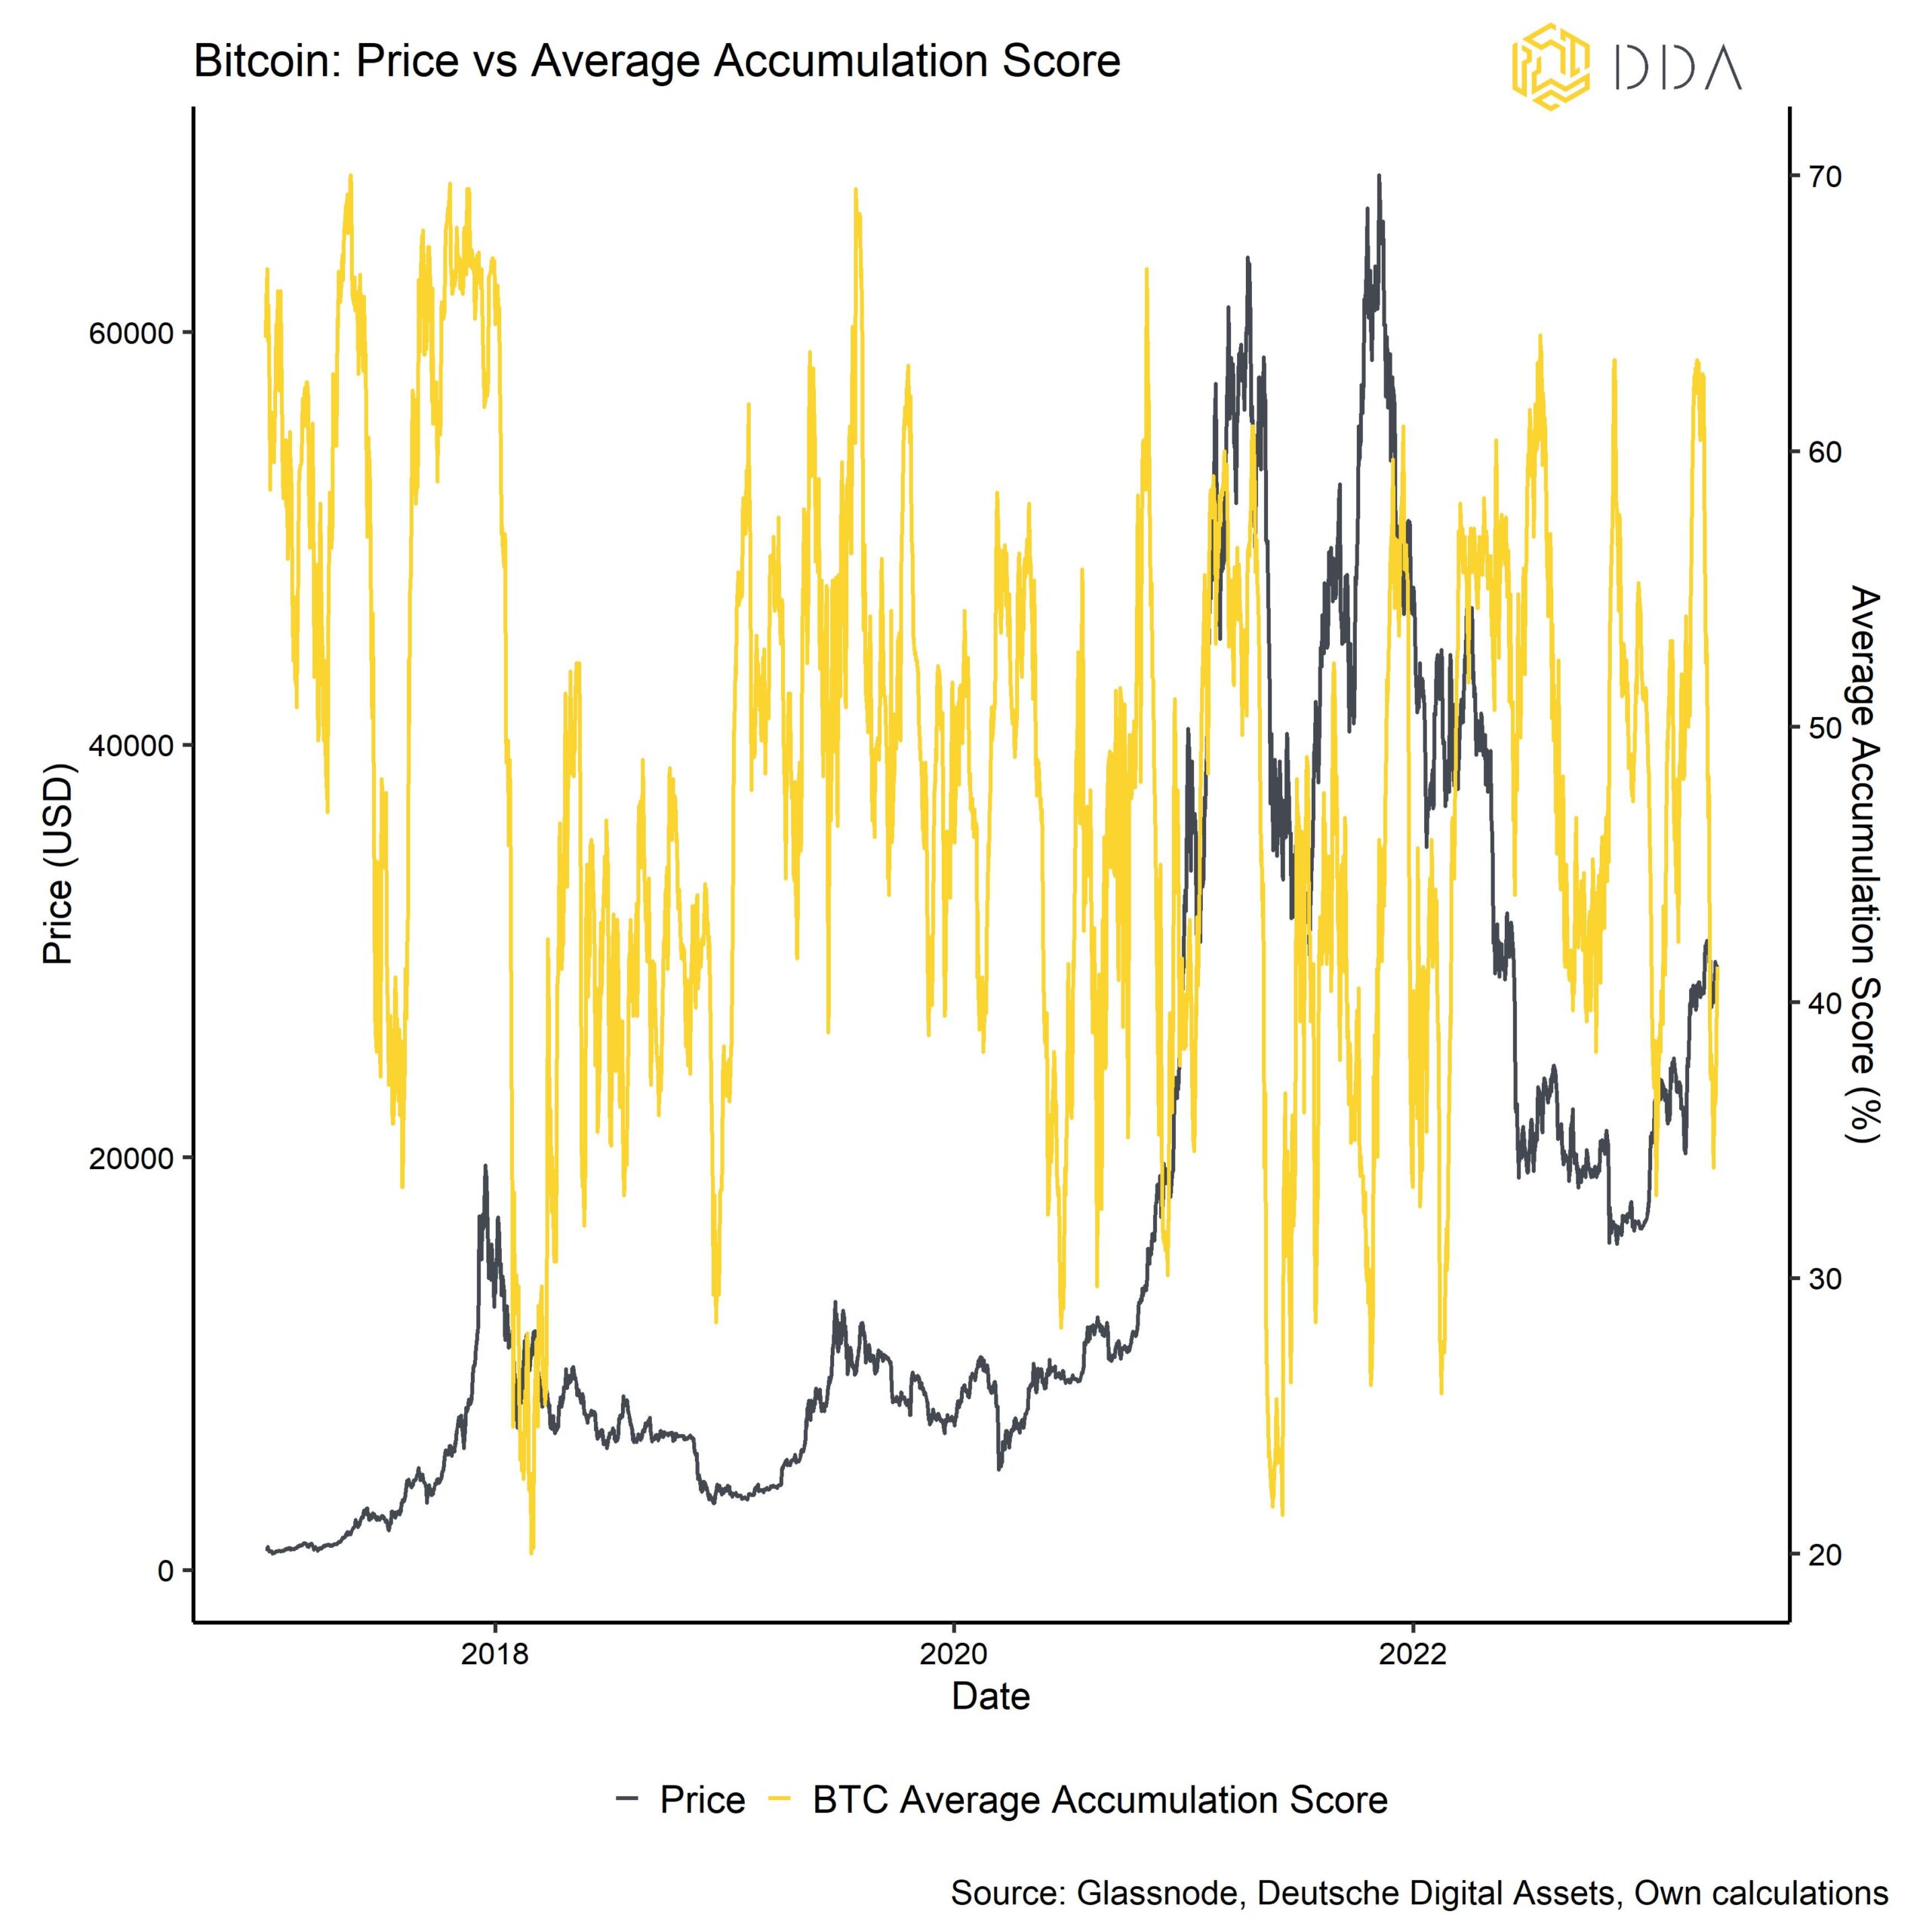
Dennoch sollten sehr niedrige Niveaus aus unserer Sicht eher als konträres Kaufsignal gesehen werden.
Die wichtigste Erkenntnis ist jedoch, dass die Kernkennzahlen für Bitcoin, wie z. B. das Gesamtüberweisungsvolumen, immer noch solide zu sein scheinen, während die Akkumulationsaktivität für Bitcoin im April nachgelassen zu haben scheint.
Diese Ansicht wird auch durch die Tatsache bestätigt, dass die Bitcoin-Börsensalden im April langsam angestiegen sind, was auf Nettobörsenzuflüsse schließen lässt, die normalerweise den Verkaufsdruck erhöhen. Gleichzeitig sind die Börsenumsätze für Ethereum weiter gesunken und haben Mehrjahrestiefststände erreicht.
Aus der Bewertungsperspektive jedoch liegt unser interner zusammengesetzter Bitcoin-Bewertungsindikator, der sieben verschiedene Bewertungsmetriken umfasst, nach unseren Berechnungen derzeit bei etwa 48%-Perzentil, während die Ethereum-Bewertungen bereits bei etwa 65%-Perzentil liegen.
Basierend auf seinen eigenen historischen Bewertungen scheint Ethereum also derzeit etwas teurer zu sein als Bitcoin, aber die Bewertungen beider Kryptoassets sind immer noch attraktiv und deuten noch nicht auf eine Überbewertung hin.
Auch unser hauseigenes Bodenwahrscheinlichkeitsmodell für Bitcoin deutet nun eindeutig darauf hin, dass das Schlimmste hinter uns liegt und höchstwahrscheinlich ein neuer Bullenmarktzyklus begonnen hat:

Allerdings deutet die historische Entwicklung von Bitcoin darauf hin, dass die Zeit bis zu neuen Allzeithochs durchaus noch mehr als ein Jahr entfernt sein könnte. Nach den historischen Drawdowns der letzten drei Baisse-Zyklen könnte man davon ausgehen, dass neue Allzeithochs für Bitcoin im Oktober 2024 erreicht werden, was auch mit der Halbierung übereinstimmen würde, die im April 2024 stattfinden wird.
Bislang hat der Bitcoin-Kurs den durchschnittlichen Erholungspfad der letzten 3 Zyklen ziemlich genau verfolgt:
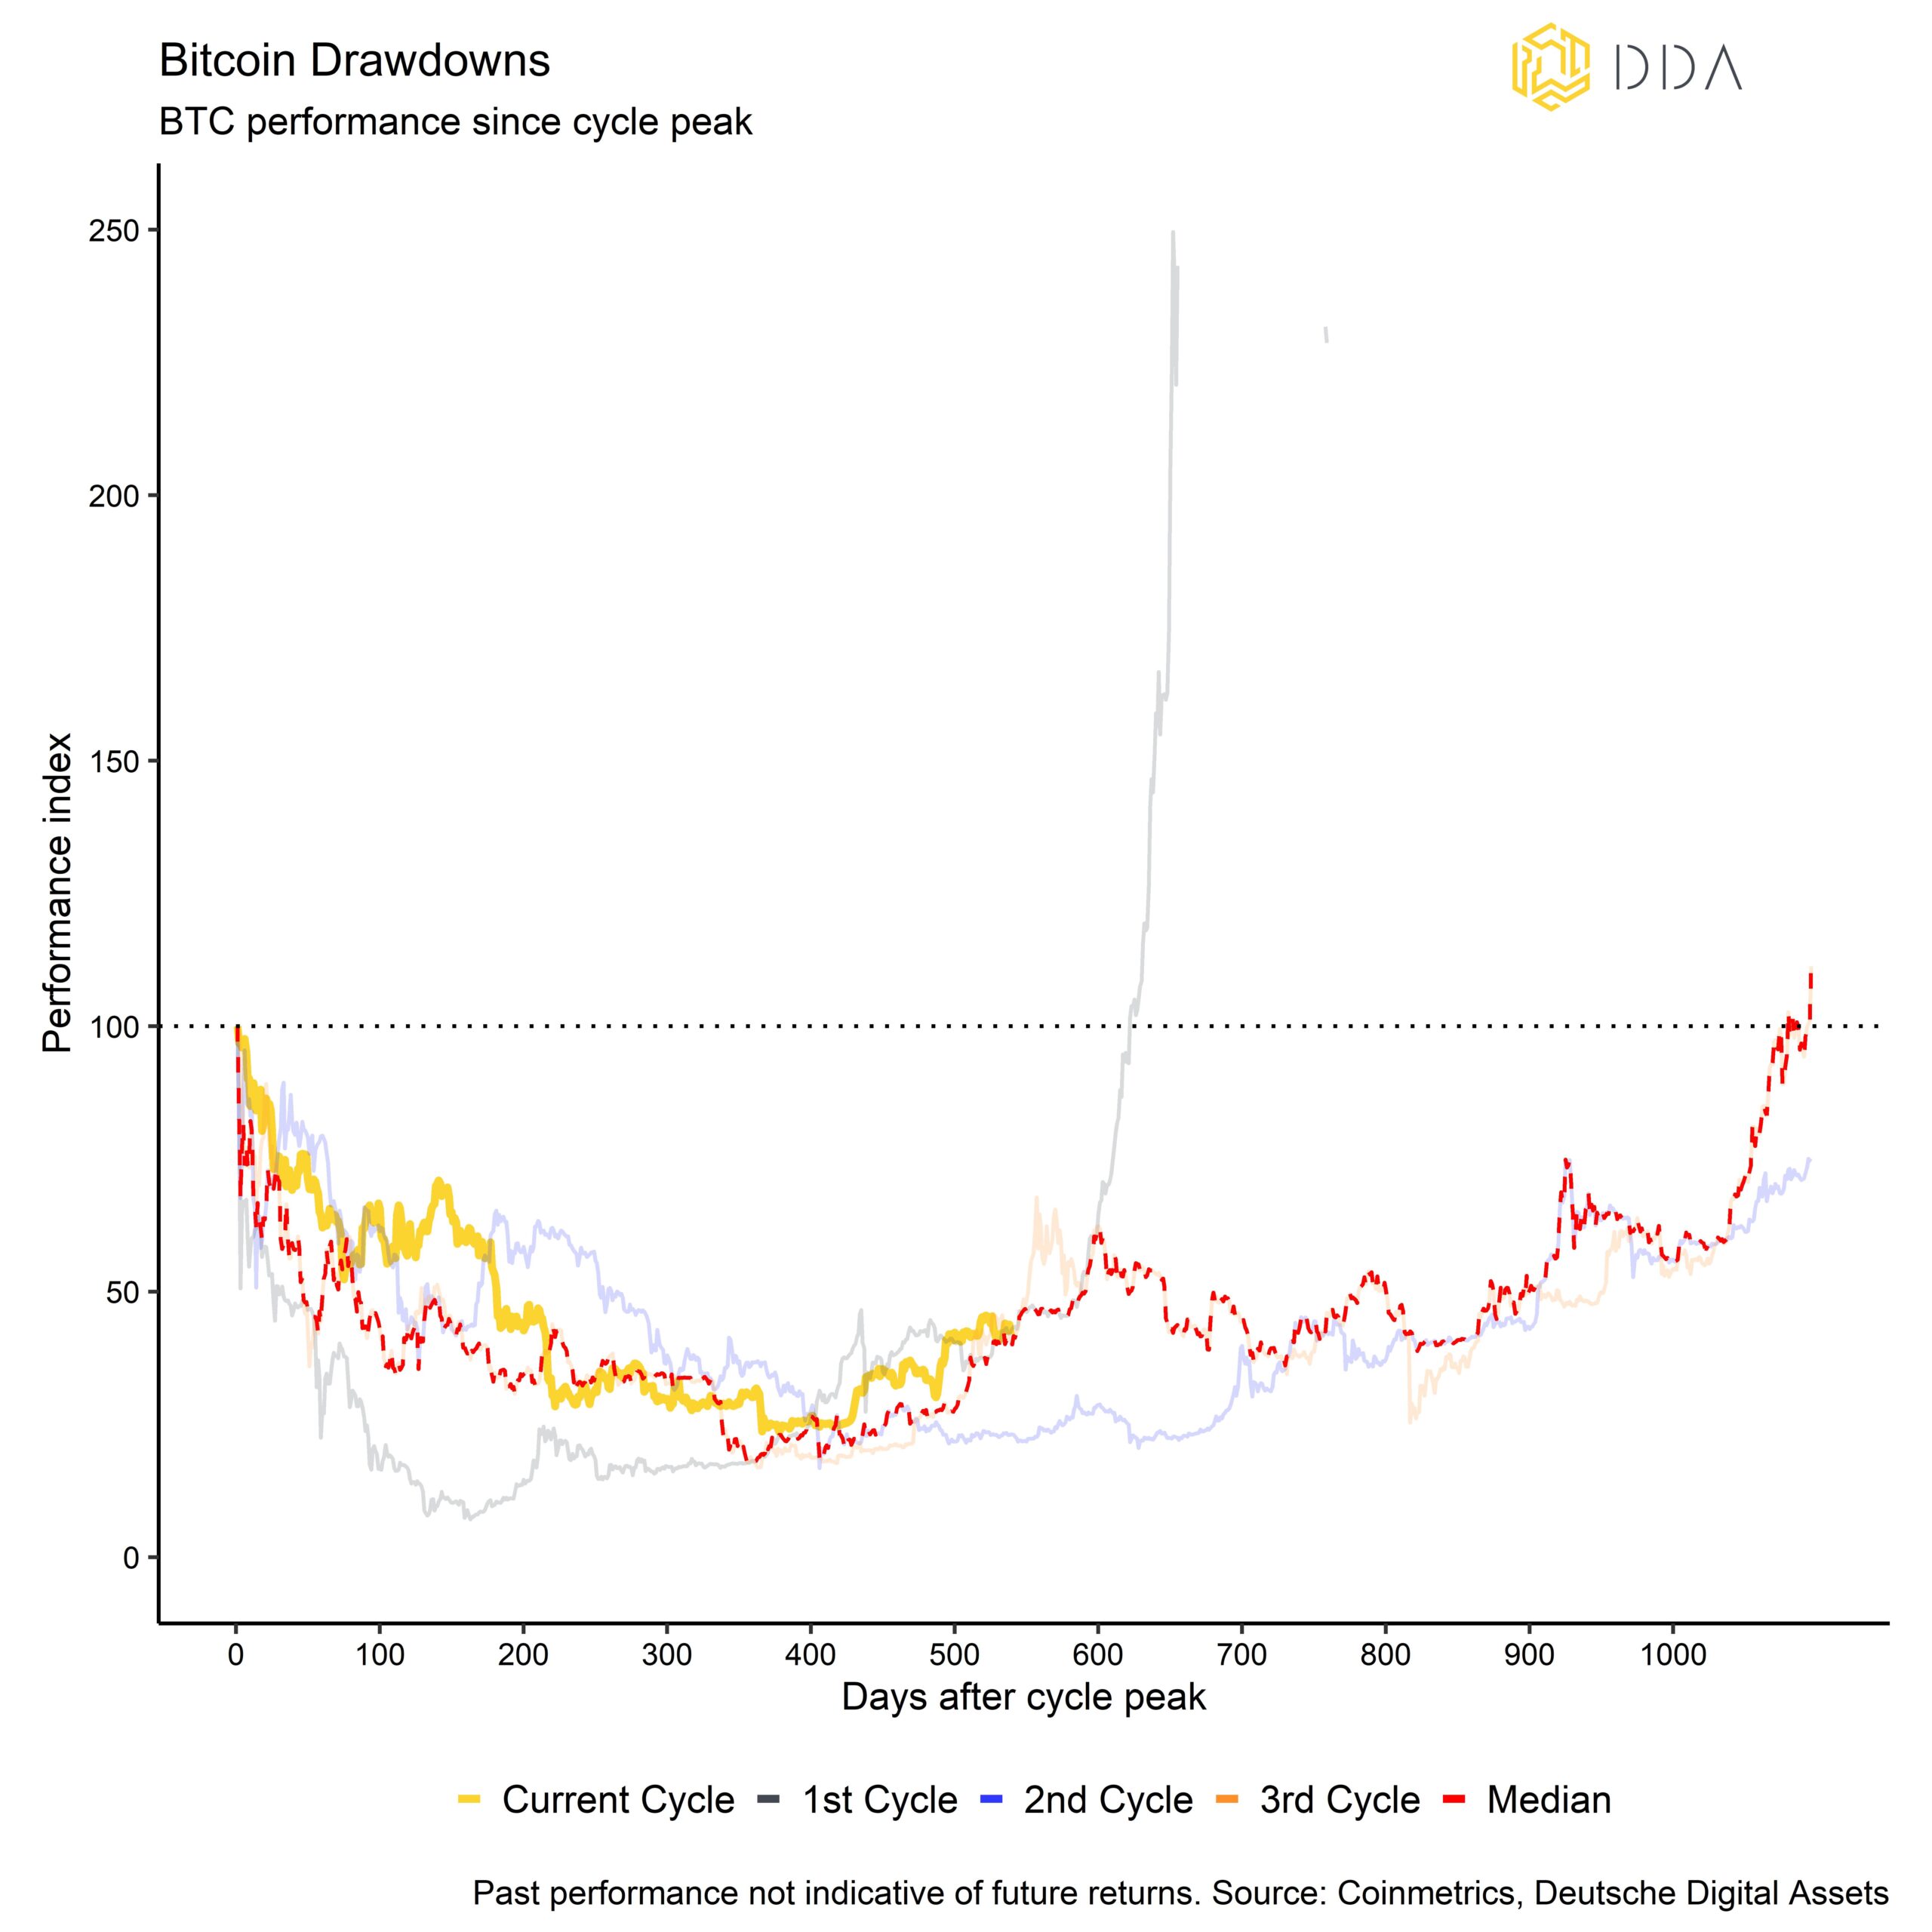
Wir gehen davon aus, dass die Kryptoasset-Preise die Tiefststände des Bärenmarktzyklus vom November 2022 nicht wieder erreichen werden und dass der Bärenmarkt höchstwahrscheinlich vorbei ist, dass aber auch kurzfristig keine neuen Allzeithochs bevorstehen.
Apropos historische Performance-Muster: Wir haben kürzlich einen kurzen Artikel über die Bitcoin-Saisonalität veröffentlicht. Lesen Sie ihn also unbedingt, falls Sie es noch nicht getan haben (siehe hier).
Neben anderen Erkenntnissen impliziert die oben erwähnte Saisonalitätsanalyse, dass Anleger ihre Positionen zumindest in den Sommermonaten halten sollten, da Mai und Juni in der Vergangenheit überdurchschnittliche Renditen für Bitcoin aufwiesen.
Unterm Strich: Das Shapella-Upgrade von Ethereum könnte als Katalysator für eine breiter angelegte "Altsaison" gedient haben - ein Marktumfeld, in dem Kryptowährungen außer Bitcoin dazu neigen, sich besser zu entwickeln. Die On-Chain-Indikatoren für Bitcoin deuten auf eine solide Netzwerkaktivität aufgrund der anhaltenden Einschreibe-Saga hin, aber auch auf eine nachlassende Akkumulationsaktivität im April.
Die Börsensalden für Bitcoin sind langsam gestiegen, während die Börsensalden für Ethereum weiter gesunken sind. Wir gehen davon aus, dass die Kryptoasset-Preise die Tiefststände aus dem Bärenmarktzyklus vom November 2022 nicht wieder erreichen werden und dass der Bärenmarkt höchstwahrscheinlich vorbei ist, aber dass neue Allzeithochs auch kurzfristig nicht unmittelbar bevorstehen.
Über DDA Deutsche Digital Assets
Deutsche Digital Assets (DDA) ist ein deutscher Digital Asset Manager, der als vertrauenswürdige Anlaufstelle für Investoren dient, die ein Exposure zu Krypto Assets suchen. Über verschiedene Tochtergesellschaften bietet DDA eine Reihe von kryptobezogenen Anlageprodukten an, die von passiven bis hin zu aktiv verwalteten Investmentlösungen reichen. Darüber hinaus bietet das Unternehmen professionelle Anlageberatung für Family Offices, High Net Worth Individuals (HNWI) und institutionelle Anleger an.
Wir bieten hervorragende Leistungen durch vertraute, vertrauenswürdige Anlagevehikel, die den Anlegern die Qualitätsgarantien bieten, die sie von einem erstklassigen Vermögensverwalter verdienen, während wir uns für unsere Mission einsetzen, die Akzeptanz von Kryptoanlagen zu fördern. DDA beseitigt die technischen Risiken von Krypto-Investitionen, indem wir Anlegern vertrauenswürdige und vertraute Mittel zur Investition in Krypto zu branchenführend niedrigen Kosten anbieten.
Haftungsausschluss
Die in diesem Artikel enthaltenen Materialien und Informationen dienen ausschließlich zu Informationszwecken. Die Deutsche Digital Assets, ihre verbundenen Unternehmen und Tochtergesellschaften fordern nicht zu Handlungen auf der Grundlage dieses Materials auf. Dieser Artikel ist weder eine Anlageberatung noch eine Empfehlung oder Aufforderung zum Kauf von Wertpapieren. Die Wertentwicklung ist unvorhersehbar. Die Wertentwicklung in der Vergangenheit ist daher kein Hinweis auf die zukünftige Wertentwicklung. Sie erklären sich damit einverstanden, Ihre eigenen Nachforschungen anzustellen und Ihre Sorgfaltspflicht zu erfüllen, bevor Sie eine Anlageentscheidung in Bezug auf die hier besprochenen Wertpapiere oder Anlagemöglichkeiten treffen. Unsere Artikel und Berichte enthalten zukunftsgerichtete Aussagen, Schätzungen, Projektionen und Meinungen. Diese können sich als wesentlich ungenau erweisen und unterliegen erheblichen Risiken und Unwägbarkeiten, die außerhalb der Kontrolle der Deutsche Digital Assets GmbH liegen. Wir gehen davon aus, dass alle hierin enthaltenen Informationen korrekt und zuverlässig sind und aus öffentlichen Quellen stammen. Diese Informationen werden jedoch "wie besehen" und ohne jegliche Garantie präsentiert.


